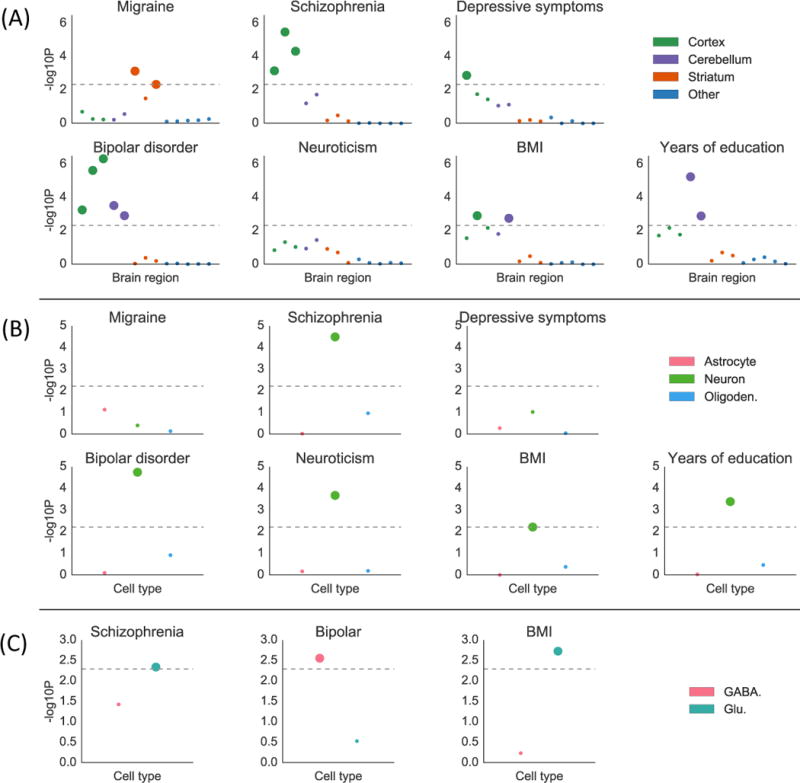
Figure 4.

Results of the brain analysis for selected traits. Numerical results for all traits are reported in Table S8. (A) Results from within-brain analysis of 13 brain regions in GTEx, classified into four groups, for seven of 12 brain-related traits. Large points passed the FDR<5% cutoff, –log10(P)=2.34. (B) Results from the data of Cahoy et al. on three brain cell types for seven of 12 brain-related traits. Large points passed the FDR<5% cutoff, –log10(P)=2.22. (C) Results from PyschENCODE data on two neuronal subtypes for three of five neuron-related traits. Large points passed the Bonferroni significance threshold in this analysis, –log10(P)=2.06. GWAS data is described in Table S4, gene expression data is described in the Online Methods and Table S8, and the statistical method is described in the Overview of Methods and the Online Methods.
