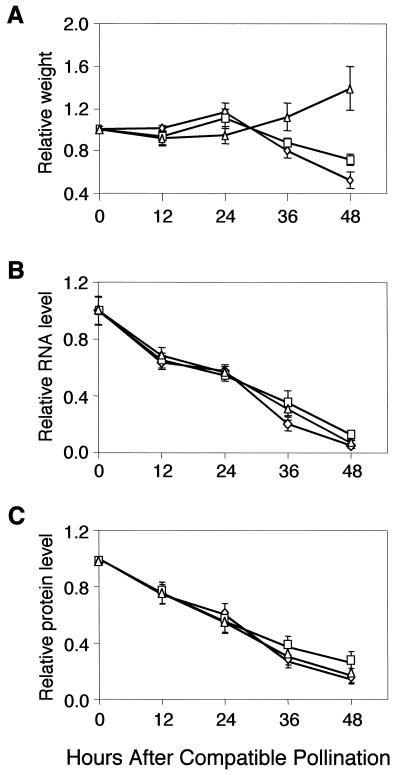
Figure 2.
Effects of compatible pollination on weight (A), protein (B), and RNA (C). Eight corollas were taken at each time point for different measurements. The average result of six independent pollination experiments was presented. For the data per corolla, data were recalculated based on the average fresh weight at each time point in order to make different parameters more comparable. Data are shown as a ratio of the parameter at the time point versus the parameter at time of flower opening. Error bars indicate the sd. 0, 12, 24, 36, and 48, HACP. A, ⋄, Fresh weight/corolla; □, dry weight/corolla; ▵, dry weight/fresh weight. B, ⋄, RNA/corolla; □, RNA/unit fresh weight; ▵, RNA/unit dry weight. C, ⋄, Protein/corolla; □, protein/unit fresh weight; ▵, protein/unit dry weight.

