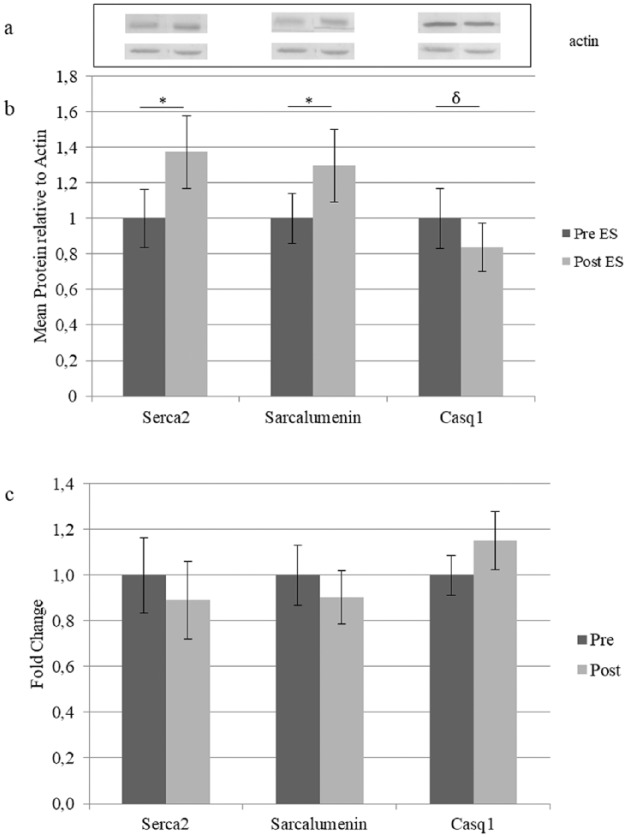
Figure 3.
Expression of SR Ca2+ handling proteins.
Note. (a) Upper part representative immunoblots obtained by antibodies specified in Figure 3b and lower part by Actin. Number of gels analyzed and replica are described in methods section. Pretreated values were set to one. Comparison between pre- and posttrained samples was performed by the nonparametric matched Wilcoxon test (W significative * for p < .05) except for Sarcalumenin which satisfied the criteria for paired Student’ T test (δ p < .05). (c) RNA analysis. Comparison between pre- and posttraining expression of indicated genes. Values are expressed as mean (n = 15) and vertical error bars represent SE; messenger RNA levels were normalized to GAPDH by the delta Ct method and then normalized to pre-ES samples which were set to one. SR = sarcoplasmic reticulum; ES = electrical stimulation.

