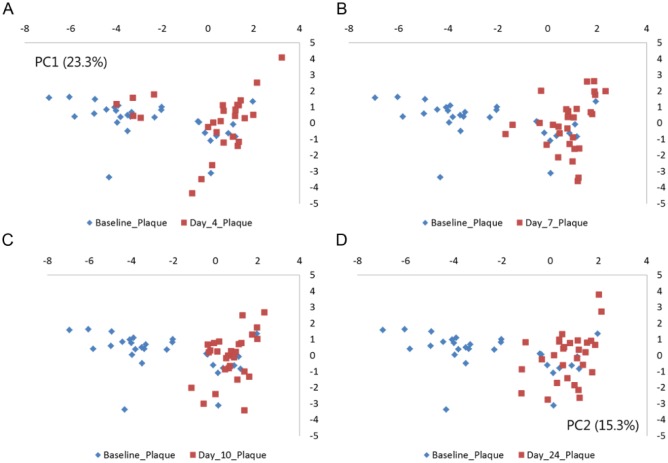
Figure 2.
Principal component analysis of supragingival microbiota. Principal component analysis comparing baseline samples with samples collected at day 4, day 7, day 10, and day 24. The x-axis is expressed as PC1 (26.3%), and y-axis is expressed as PC2 (15.3%). (A) Baseline (blue) vs. day 4 (red). (B) Baseline (blue) vs. day 7 (red). (C) Baseline (blue) vs. day 10. (D) Baseline vs. day 24 (red).

