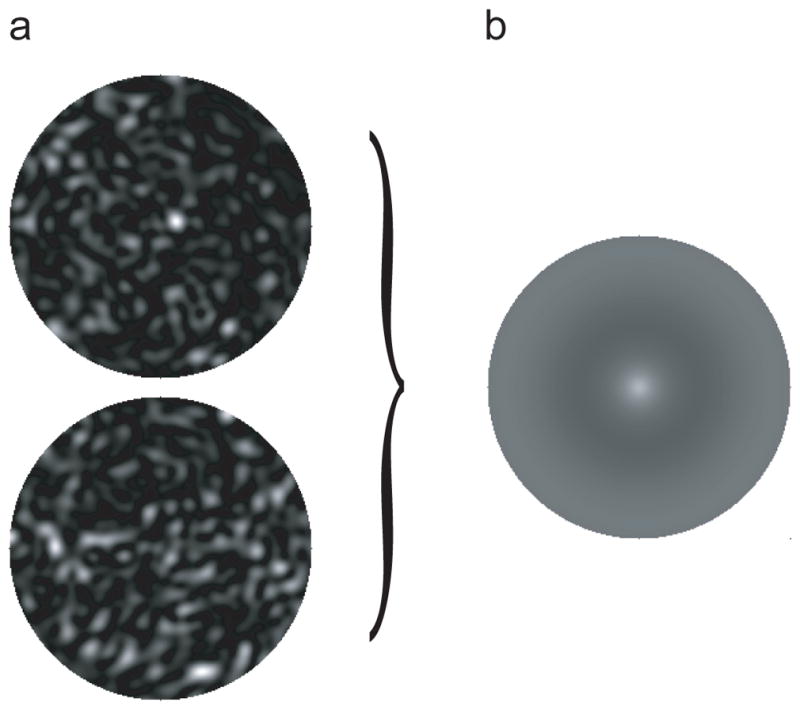
Fig. 20.

(a) Angular distributions of the scattered intensity for two fixed spherical particulate volumes. (b) As in panel (a), but averaged over random particle positions. The gray scale is individually adjusted in order to maximally reveal the fine structure of each scattering pattern. Fig. 19b shows the angular coordinates used for all three panels.
