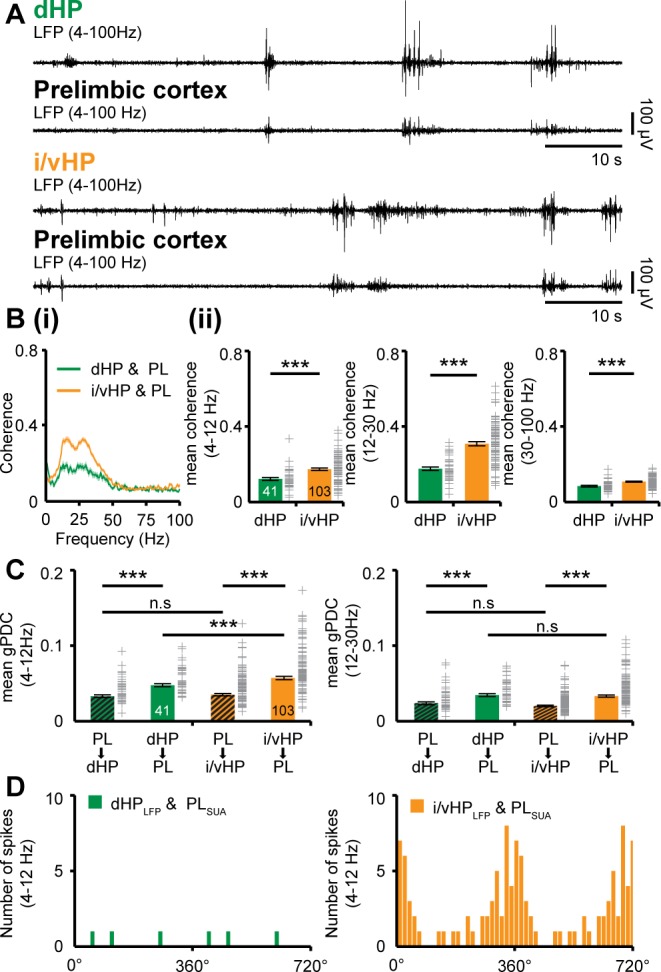
Figure 2. Dynamic coupling of hippocampal and prefrontal oscillatory activity along septo-temporal axis during neonatal development.
(A) Simultaneous LFP recordings of discontinuous oscillatory activity in dHP and PL (top) and i/vHP and PL (bottom). (B) Long-range synchrony within prefrontal-hippocampal networks. (i) Average coherence spectra for simultaneously recorded oscillatory events in dHP and PL as well as i/vHP and PL. (ii) Bar diagrams (mean ±SEM) displaying the coherence in theta (4–12 Hz), beta (12–30 Hz), and gamma (30–100 Hz) band when averaged for all investigated mice. (C) Directed interactions between PL and either dHP or i/vHP monitored by general Partial Directed Coherence (gPDC). Bar diagrams displaying the gPDC calculated for theta (4–12 Hz, left) and beta (12–30 Hz, right) frequency and averaged for all investigated animals (n = 41 mice for dHP and PL, n = 103 mice for i/vHP and PL). (D) Histograms displaying the phase-locking of prelimbic spikes to theta oscillations in dHP (left) and i/vHP (right). Note the different proportion of spikes significantly locked along the septo-temporal axis (dHP, 3 of 46 units; i/vHP, 52 of 310 units). Data are represented as mean ± SEM. *p<0.05, ***p<0.001.

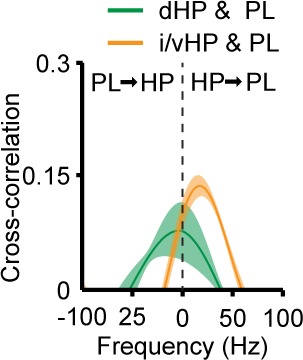
Figure 2—figure supplement 1. Cross-correlation of the amplitudes of band pass (4–12 Hz)-filtered LFP recorded from dHP and PL (green) as well as from i/vHP and PL (orange).

