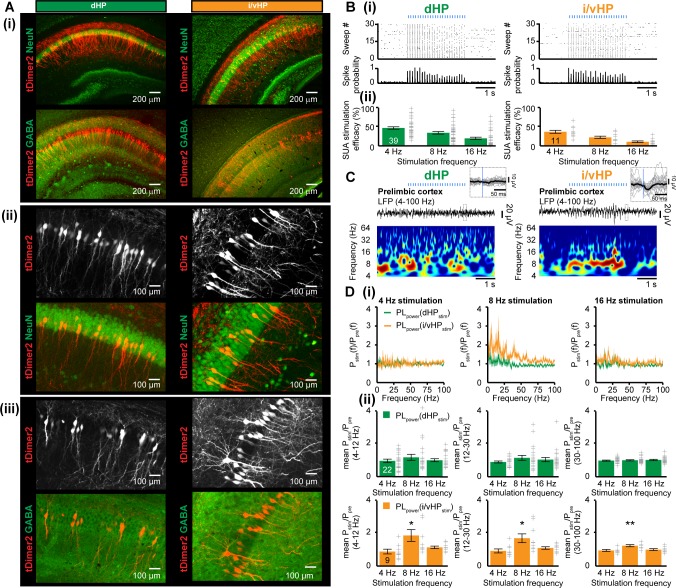
Figure 5. Optogenetic activation of pyramidal neurons in the CA1 area of dHP and i/vHP has different effects on the network activity of neonatal PL.
(A) Cell- and layer-specific transfection of dHP or i/vHP with CAG-ChR2(ET/TC)−2A-tDimer2 by site-directed IUE. (i) Photomicrographs depicting tDimer2-expressing pyramidal neurons (red) in the CA1 region of dHP (left) and i/vHP (right) when stained for NeuN (green, top panels) or GABA (green, bottom panels). (ii) Photomicrographs depicting the transfected hippocampal neurons when co-stained for NeuN and displayed at larger magnification. (iii) Photomicrographs depicting transfected hippocampal neurons when co-stained for GABA and displayed at larger magnification. (B) Optogenetic activation of pyramidal neurons in CA1 area along septo-temporal axis. (i) Representative raster plot and corresponding spike probability histogram for dHP (left) and i/vHP (right) in response to 30 sweeps of 8 Hz pulse stimulation (3 ms pulse length, 473 nm). (ii) Bar diagram displaying the efficacy of inducing spiking in dHP and i/vHP of different stimulation frequencies. (C) Characteristic light-induced discontinuous oscillatory activity in the PL of a P10 mouse after transfection of pyramidal neurons in the CA1 area of the dHP (left) or i/vHP (right) with ChR2(ET/TC) by IUE. The LFP is displayed after band-pass filtering (4–100 Hz) together with the corresponding color-coded wavelet spectrum at identical time scale. Inset, individual (gray) and averaged (black) prelimbic LFP traces displayed at larger time scale in response to light stimulation in HP. (D) Power analysis of prelimbic oscillatory activity Pstim(f) after light stimulation of dHP (green) and i/v HP (orange) at different frequencies (4, 8, 16 Hz) normalized to the activity before stimulus Ppre(f). (i) Power spectra (0–100 Hz) averaged for all investigated mice. (ii) Bar diagrams displaying mean power changes in PL during stimulation of either dHP (top panels) or i/vHP (bottom panels). Data are represented as mean ± SEM. *p<0.05, **p<0.01.
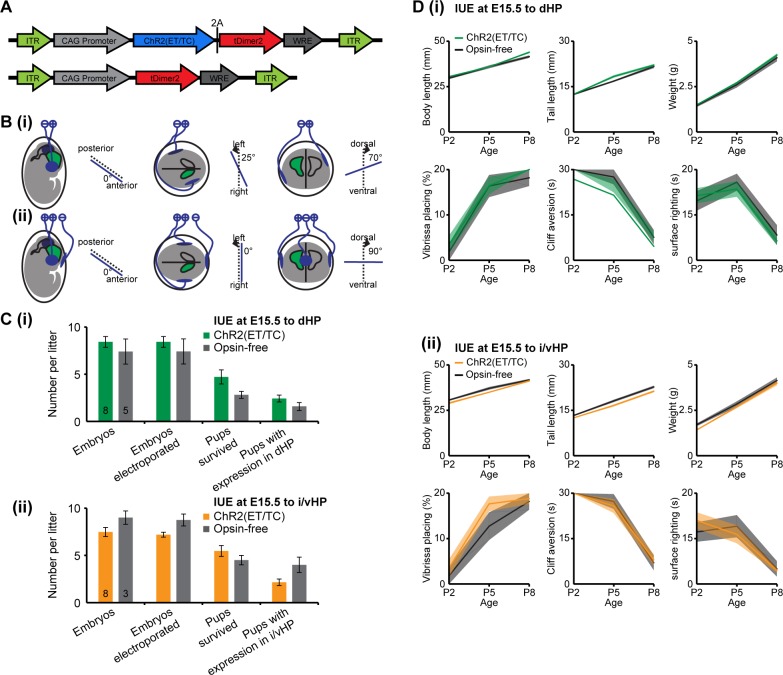
Figure 5—figure supplement 1. Experimental protocol for in utero electroporation of the hippocampus.
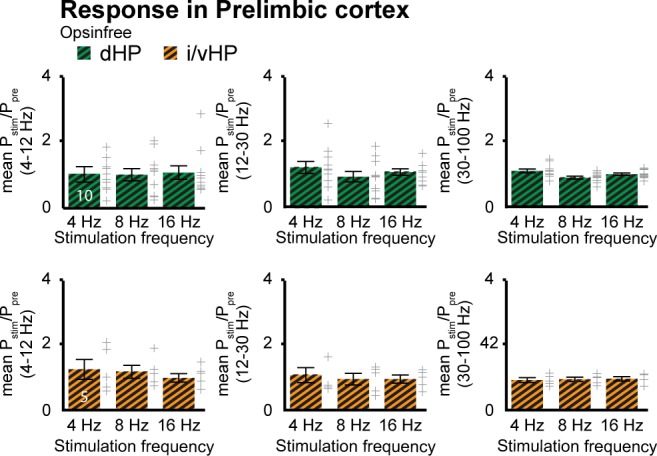
Figure 5—figure supplement 2. Response in prelimbic cortex for opsin-free animals.


