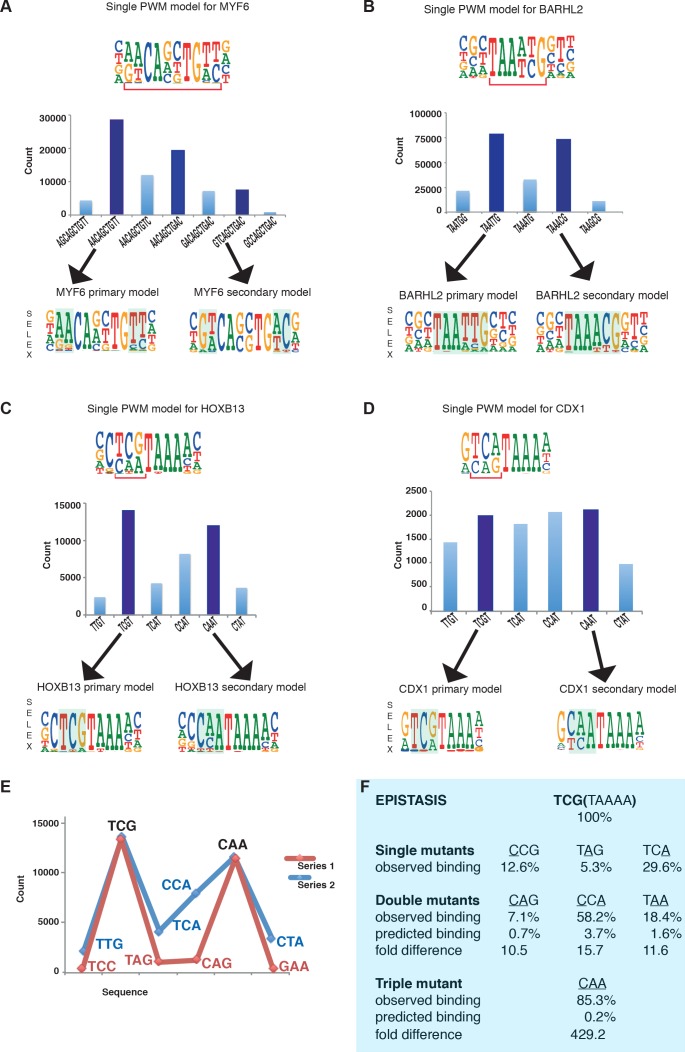
Figure 1. Multiple TFs prefer to bind to two optimal sequences.
(A) MYF6 (this study); (B) BARHL2 (this study); (C) HOXB13 (Yin et al., 2017); (D) CDX1 (Yin et al., 2017). Note that single PWM models (top) fail to describe sequence specificity towards different sequences shown in the bar graphs (middle). For example, a single PWM model for HOXB13 (panel C, top) predicts near-equal affinities towards sequences TCG and TCA at the position of the bracket, and lower affinity towards CAA. Analysis of the counts of the subsequences (middle), instead, reveals that the TCA sequence is bound more weakly than the two most preferred sequences TCG and CAA. Counts for local maxima (dark blue) and related sequences that differ from the maxima by one or more base substitutions are also shown (light blue). The bars between the maxima represent sequences that can be obtained from both maximal sequences and have the highest count between the maxima. Bottom of each figure: Two distinct models that can represent the binding specificity of the TFs, the divergent bases are indicated by shading. For clarity, the PWM for the MYF6 optima that contains both AA and AC dinucleotide flanks (middle dark blue bar in A) is not shown. (E) Sequences representing the highest (blue line) and lowest (red line) affinity sequences between the two optimal HOXB13 sequences. y-axis: counts for 8-mer sequences containing the indicated trinucleotide followed by TAAA. (F) Epistasis in HOXB13-DNA binding. The effect of individual mutations (single mutants) to the optimal sequence TCGTAAAA (top) are relatively severe, with binding decreasing by more than 70% in all cases (observed binding). However, combinations of the mutations (double mutants) do not decrease HOXB13 binding in a multiplicative manner (compare predicted and observed binding). A multiplicative model predicts that combining all three substitutions would abolish binding, but instead the CAA site is bound more strongly than any other mutant (triple mutant).


