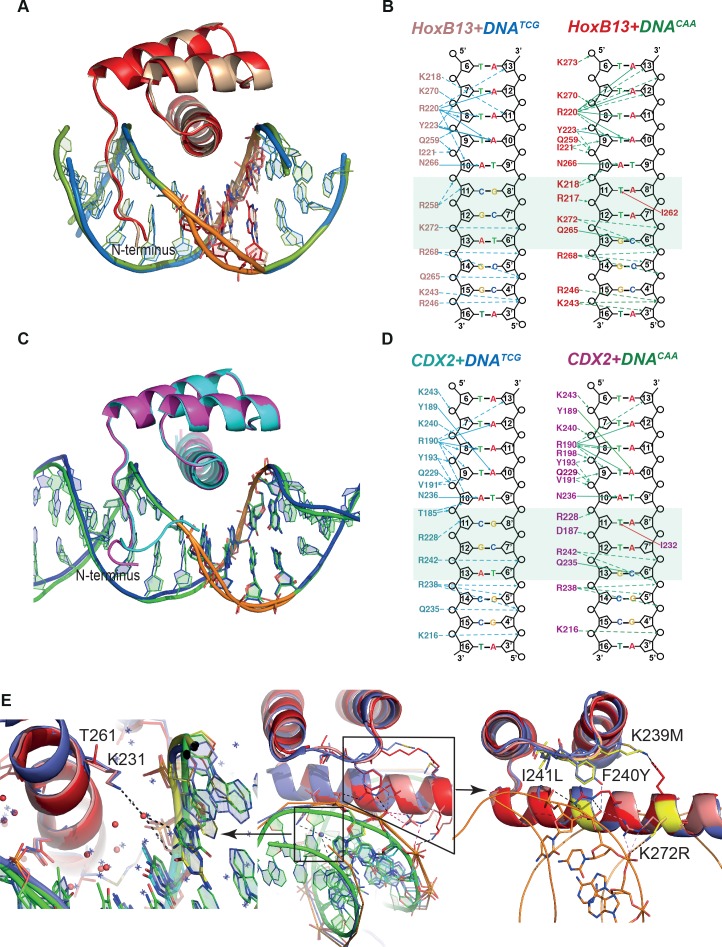
Figure 2. Comparison of Protein-DNA complexes.
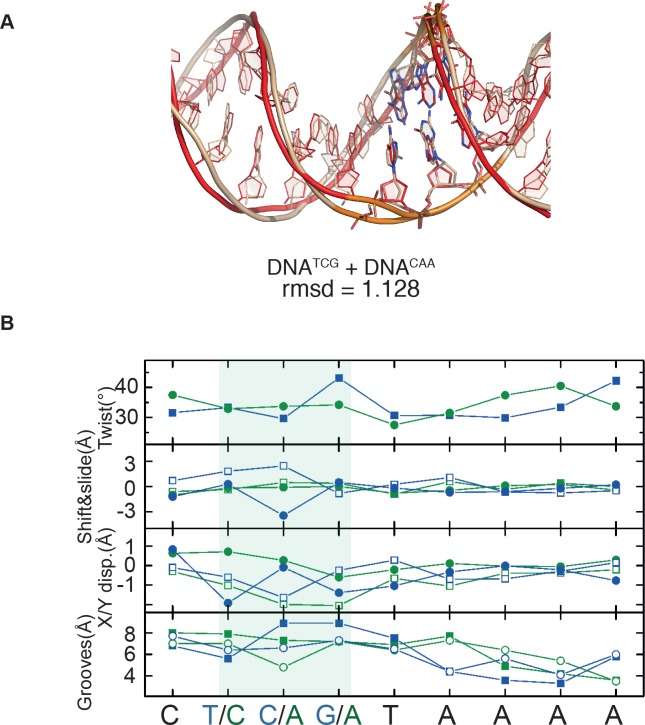
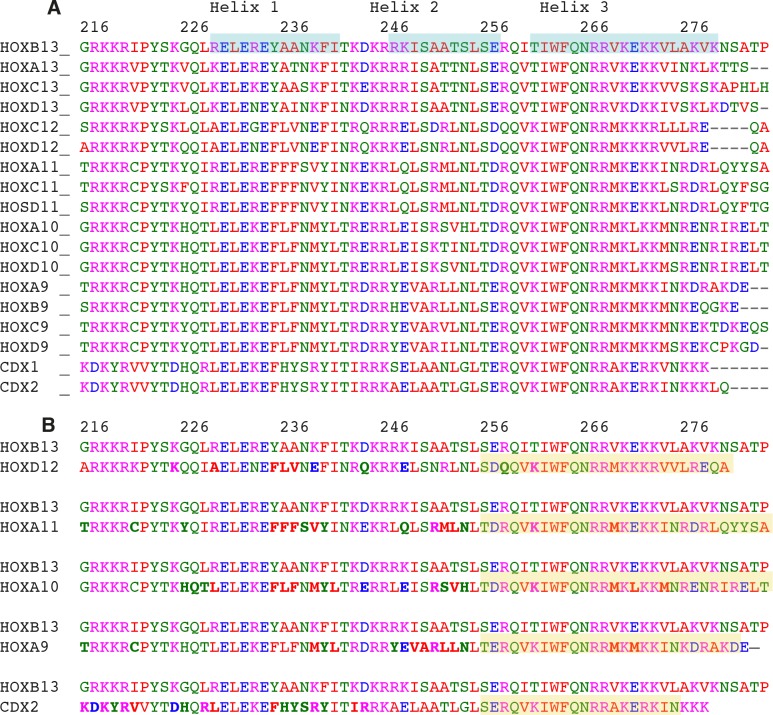
(A) The view of superposition of HOXB13 (wheat) bound to DNATCG and HOXB13 (red) bound to DNACAA (rmsd = 0.813 Å on 57 residues). The respective DNAs are in blue and green. The dissimilar base pairs are presented as ball-and-stick models and colored as the proteins, DNATCG is wheat and DNACAA is red. Note the different bending of the DNA backbone at these positions (orange). (B) Schematic representation of interactions formed between HOXB13 DBD and the two different DNAs: left panel shows the interactions between HOXB13 and the primary binding site (DNATCG) and right panel represents the interactions of HOXB13 with the secondary site (DNACAA), respectively. Dashed lines represent interaction with backbone phosphates and deoxyribose and solid lines interactions with the bases. The protein residues belonging to the HOXB13-DNATCG and HOXB13-DNACAA structures are colored wheat and red, respectively. The divergent parts of the DNA sequences are highlighted by a light green box. Note that the TCG site lacks direct contacts to the DNA bases, whereas the CAA site is recognized by direct contacts by Gln-265 and Ile-262. Most other contacts are similar in both structures. The four As of the TAAAA sequence are recognized by the N-terminal amino-acids interacting with the DNA backbone via the minor groove, whereas the T is recognized by a bidentate interaction formed between its complementary adenine A10 and the side chain of asparagine Asn-266. Two hydrogen bonds are formed between nitrogen atoms N6 and N7 from adenine base and oxygen and nitrogen atoms of the Asn-266 side chain. This adenine-specific asparagine is totally conserved in the HOX family. (C) Superposition of CDX2 (cyan) bound to DNATCG and CDX2 (magenta) bound to DNACAA (rmsd = 0.270 Å on 64 residues). The respective DNAs are in blue and green. The dissimilar base pairs are presented as ball-and-stick models and colored as the proteins, DNATCG is green and DNACAA is blue. Note the different bending of the DNA backbone at these positions (orange). (D) Schematic representation of interactions formed between CDX2 DBD and the two different DNAs. (E) Structural interpretation of mutations that change the specificity of HOXB13: the mutations changing Ccaa/Ctcg to Gcaa/Gtcg are shown in a small box and, as a close view, on the left panel, and mutations, which switch the preferences of HOXB13 from CTCG to CCAA, are shown in big box and, as a close view, on the right panel. The mutations are presented in structural alignment of HOXB13 (red), HOXA9 (blue, PDB entry 1PUF) and CDX2 (pink) bound to DNA. Note the unique mutation of Lys (small box), which is conserved in all known HOXes, to Thr in HOXB13 allows HOXB13 to accept any base pair in the position before TCG/CAA. The left panel is representing the close view to the interactions formed by Lys in HOXA9 and CDX2. Long aliphatic chain of Lys increases the hydrophobicity of this part of protein-DNA interface, pushing out the water molecules. Dashed line indicates water-mediated interaction between the ε-Amino group of Lys and the N7 and O6 of the guanine base at the Gtcg sequence. The right panel is representing the close view of triple mutation in the loop connecting helix 1 and helix 2: Lys-239/Met, Phe-240/Tyr and Ile-241/Leu; and single mutation of Lys-272/Arg. Those mutations are expected to change the hydrogen bond network between the protein and DNA and lead to a preference towards the more rigid, more B-shaped DNACAA.


