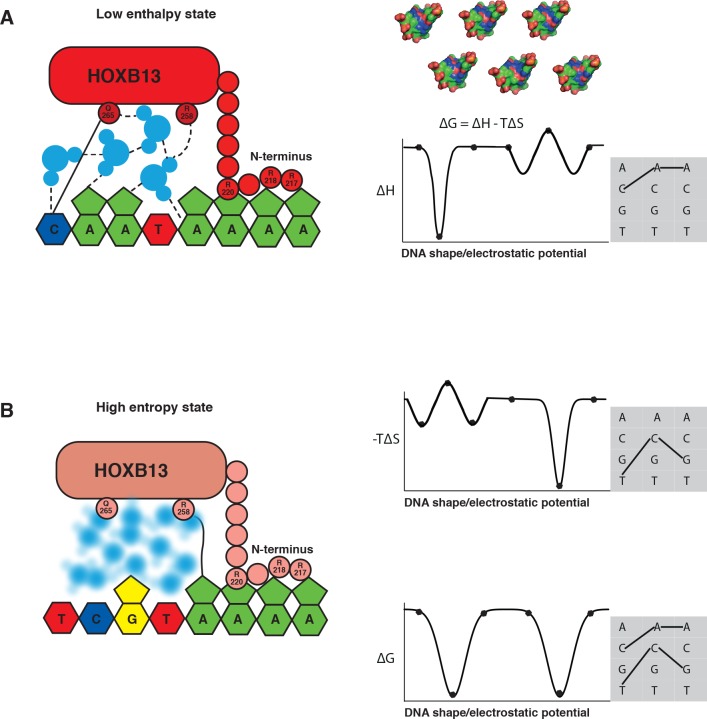
Figure 6. The two optimal sites bound by HOXB13 represent enthalpy and entropy-driven optima.
(A–B) Schematic cartoon illustrations of the binding mechanism driven by the low enthalpy (A) and by high entropy (B) are presented in the left panels. The DNA bases are presented as pyrimidine and purine rings, protein is represented as ellipsoid, N-terminus is shown bound to the minor groove created by A-stretch, and water molecules are shown schematically and colored blue. The dashed lines represent hydrogen bonds observed in the low enthalpy state; the solid line represents direct interactions between amino acids and bases. The blurred water molecules indicate the high entropy state. Hydrogen bonds that are common to both complexes are omitted for clarity. Graphs on the right show schematic illustration of the variance of enthalpy (ΔH, top), entropy (-TΔS, middle) and Gibbs free energy (ΔG) (bottom) as a function of an idealized one-dimensional continuous variable representing the high-dimensional variables of shape, electrostatic charge and vibration of DNA that vary as a function of the DNA sequence. As DNA is composed of only four bases, only discrete positions along this axis are possible (indicated by dots). Example models of shape and charge distribution of different DNA sequences (from Figure 1C) are shown as surface representation above the scheme. The surfaces are colored according to the charge distribution: positively charged atoms are in blue, negatively charged are in red and neutral atoms are in green. Note that enthalpy and entropy are partially negatively correlated, leading to binding promiscuity (wider optima in ΔG compared to ΔH and ΔS). The remaining uncorrelated component leads to the presence of two optima for ΔG (bottom). Shaded boxes on the right show simplified dinucleotide binding models that illustrate how this leads to two distinct locally optimal sequences. Note that the values are for illustration purposes only and the ‘bumps’ illustrate local entropy-enthalpy compensation that broadens the peaks of ΔG.

