. 2018 Apr 10;7:e29053. doi: 10.7554/eLife.29053

Figure 2. Use of the echo model to determine the bat’s ongoing sensory signal reception.

(A) Cartoon of a bat flying through space encountering two obstacles. The bat’s flight trajectory moves from right to left, and is indicated by the black dotted line. Two sonar vocalizations while flying are indicated by the gray cones. (B) Reconstruction of sonar vocal times (top), and returning echo times (bottom) for the cartoon bat in panel a. Note that two echoes (blue and yellow) return to the bat following the first sonar vocalization, while only one echo (yellow) returns after the second vocalization, because the relative positions of the bat and objects change over time. (C) One experimental trial of the bat flying and navigating around obstacles (large circular objects). The bat’s flight path (long black line) starts at the right and the bat flies to the left. Each vocalization is indicated with a yellow circle, and the direction of the vocalization is shown with a short black line. (D) Trial time versus solid angle to each obstacle for flight shown in C. Individual vocalizations are indicated with black circles, and the color of each line corresponds to the objects shown in C. (E) Time expanded spectrogram of highlighted region in D. Shown are three sonar vocalizations, and the colored lines indicate the time of arrival of each object’s echo as determined by the echo model (colors as in C and D). (F) Snapshot of highlighted region (open black circle) in panel C showing the position of objects when the bat vocalized at that moment. (G) Snapshot of highlighted region (open red circle) in panel C showing the position of objects when the bat vocalized at that moment. In panels F and G, orange circles are microphones (only part of the array is shown here).

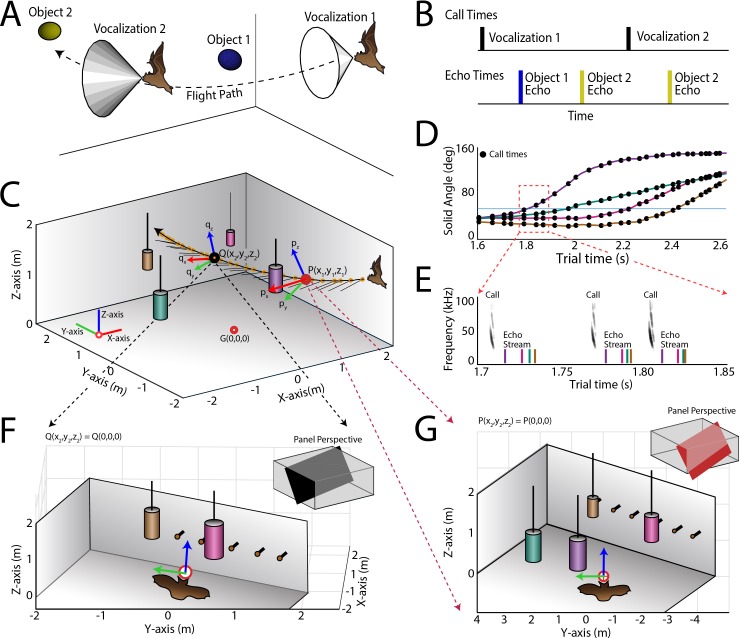
Figure 2.

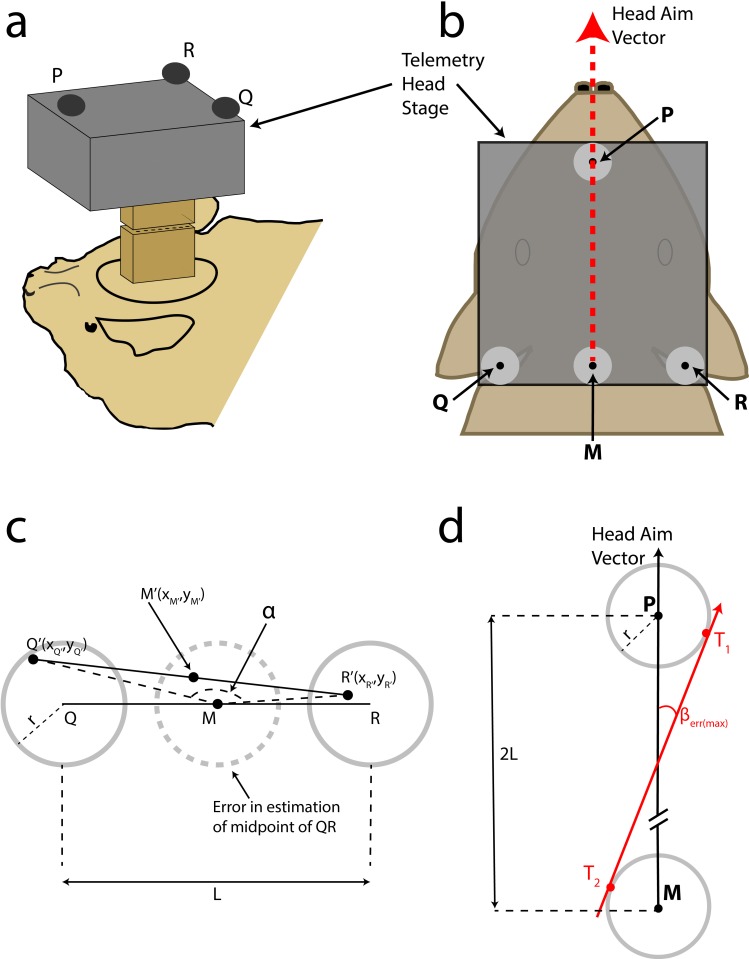
Figure 2—figure supplement 1. Head aim reconstruction.

Figure 2—figure supplement 1.

(A) Cartoon of the bat with the TBSI telemetry head-stage (grey box), and the Omnetics connectors (brown boxes), which connect the head-stage with the plug on the bat’s head. (B) Top view of the bat’s head with the telemetry head-stage (grey rectangle) and head markers, P,Q and R. Grey circles around the markers indicate the maximum error in reconstruction. M is the midpoint of Q and R. The reconstructed head-aim is indicated by the red arrow. (C) Estimation of the maximum error in reconstruction of the midpoint of QR (see Materials and methods for details). (D) Estimation of the maximum error in the measurement of the head-aim vector (see Materials and methods for details).
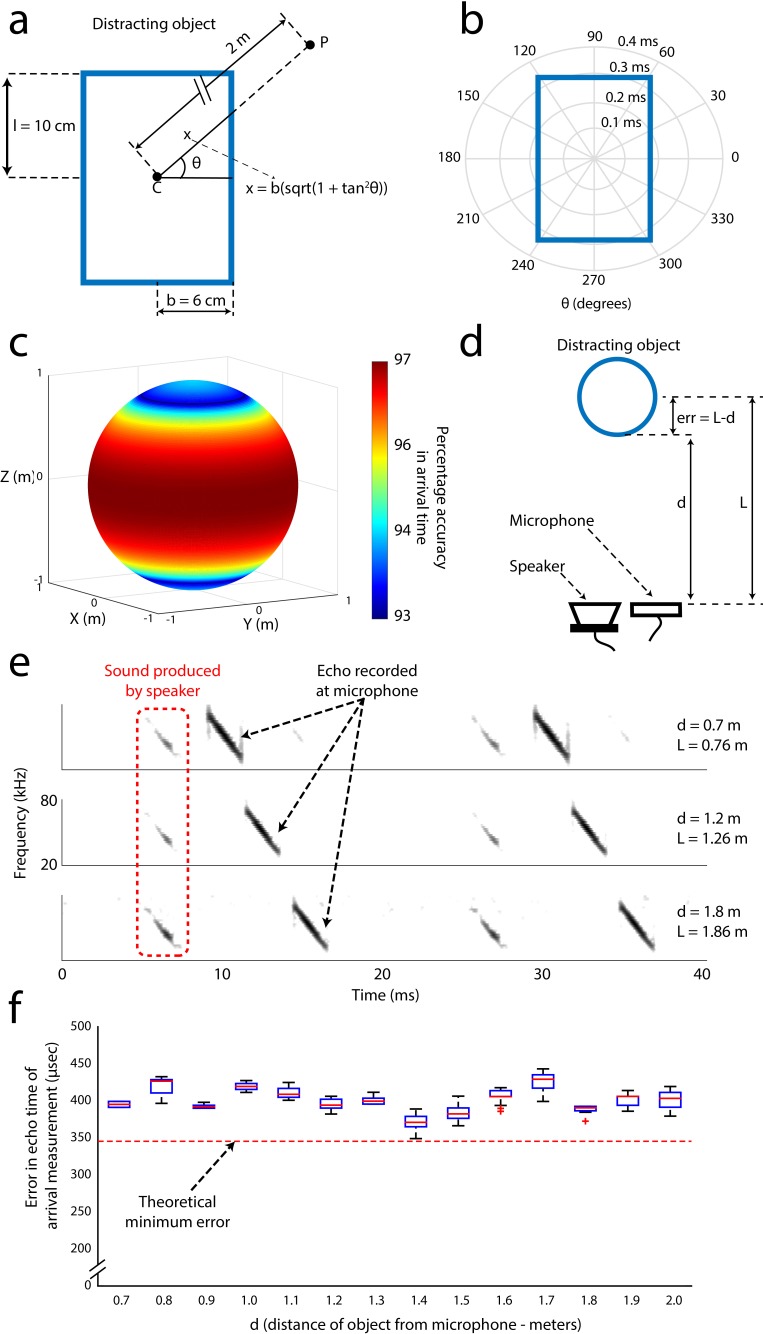
Figure 2—figure supplement 2. Error analysis and validation of the echo-model.

Figure 2—figure supplement 2.

(A) Cross-section of the cylindrical object placed along the flight path of the object. The height and radius of the object are 10 cm and 6 cm respectively. P is an example point in the trajectory of the bat at a distance of 2 m from the center of the object. (B) Polar plot demonstrating how the error in the measurement of the echo arrival changes a function of the angular position of the bat with respect to the angle between the bat and the horizontal direction. (C) Accuracy in the estimation of the echo arrival time as a function of the 3D position, along a sphere of 2 m radius, of the bat with respect to the center of the object. (D) Arrangement used to validate the echo model. Here, the distance of the object from the microphone/speaker is ‘d’ while ‘L’ is the distance used by the echo model due to the point object approximation. This introduces a systematic error of ‘L-d’ in the time of arrival of the echo. The distance of the object from the speaker/microphone was varied and measurements of echo arrival time were made and verified with the echo model E) Spectrograms of microphone recordings when the object was placed 0.7, 1.2 and 1.8 meters away from the recording microphone. (F) Box plots (n = 20 for each distance) showing the error in the time estimated by the echo model, computed as 2*(d–L). The echo model estimate of target distance matched the theoretical error bounds (see Materials and methods and Figure 3—figure supplement 1A, B and C) within an error less than 0.1 milliseconds.