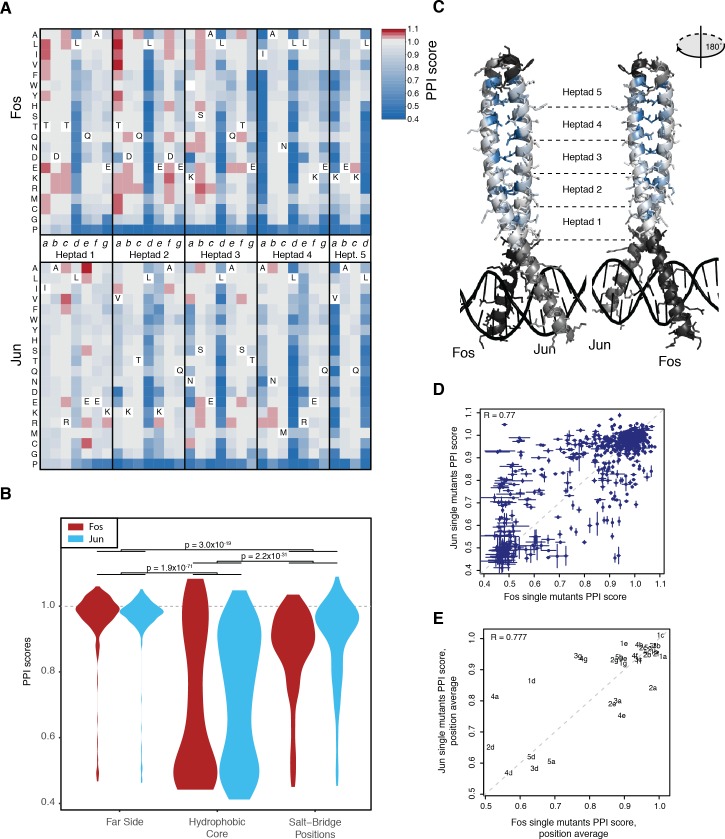
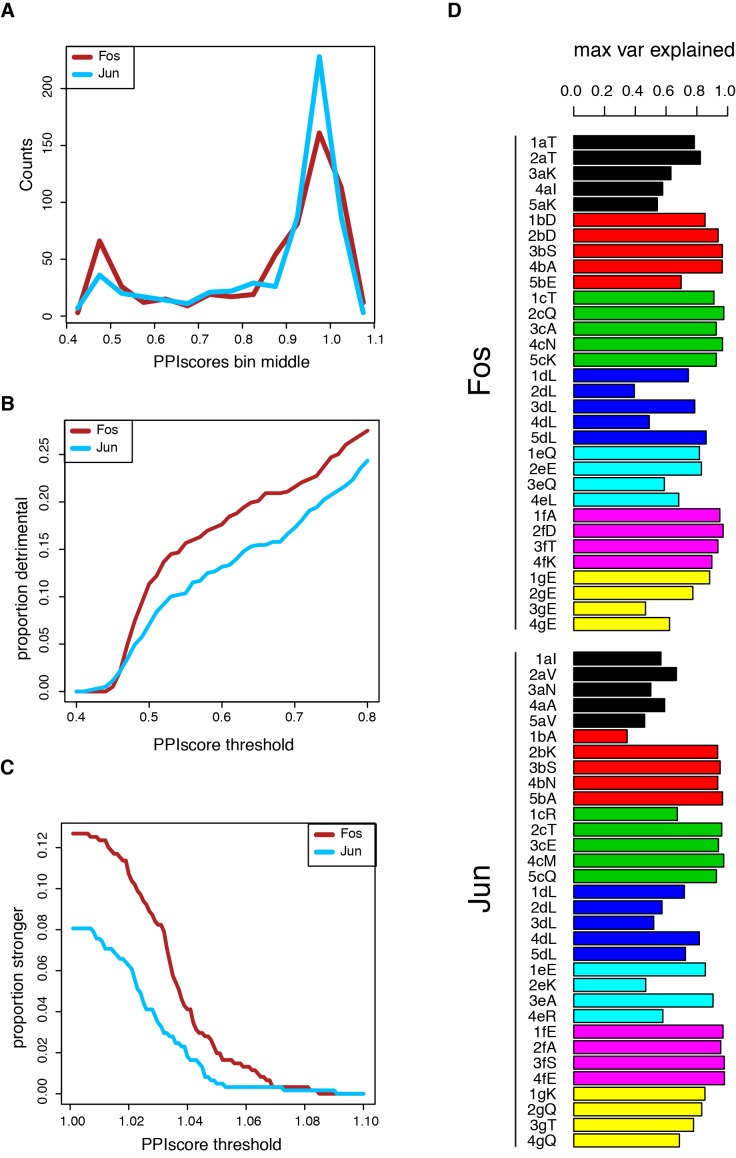
Figure 2. Effects of single mutants.
(A) Heatmap of single mutant PPI scores averaged between the three replicates. Letters inside the heatmap represent the wild-type amino acid. White represents missing data. (B) Distribution of PPI scores per position types. p-Values from Welch t-test. (C) Average PPI score per position overlaid on the crystal structure (pdb: 1fos). Black and gray represent positions not mutated in Fos and Jun, respectively. (D) Scatter plot between PPI scores of corresponding single mutations at the same positions in Fos and Jun. Error bars represent 95% confidence intervals. (E) Scatter plot between average PPI score per corresponding positions in Fos and Jun. The number represents the heptad and the letter the position inside the heptad.


