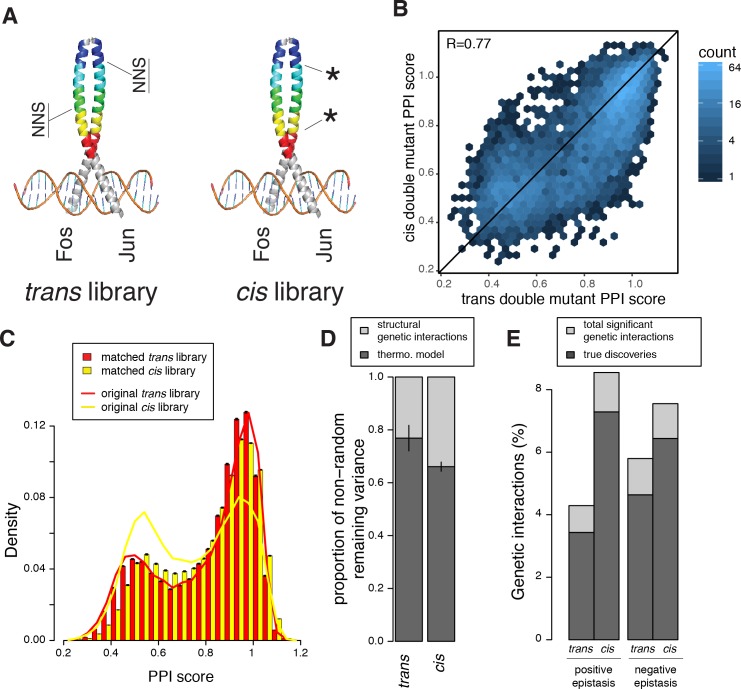
Figure 5. Comparison of double mutant mutation outcome and genetic interactions in cis and trans.
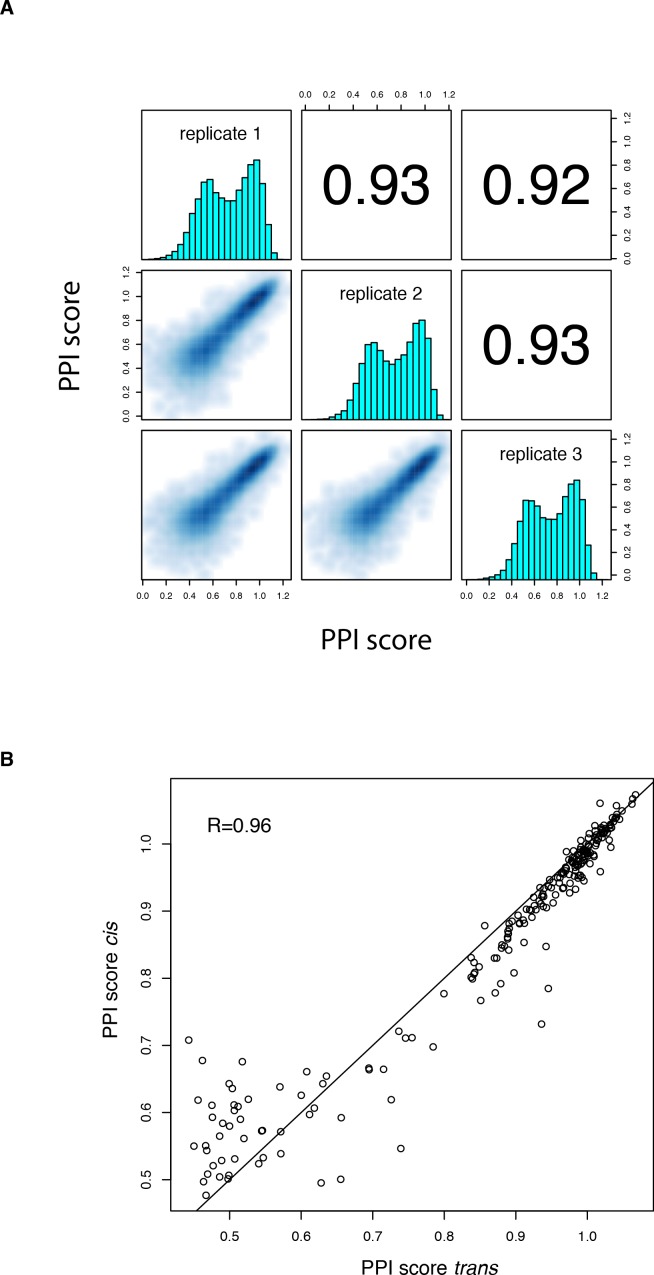
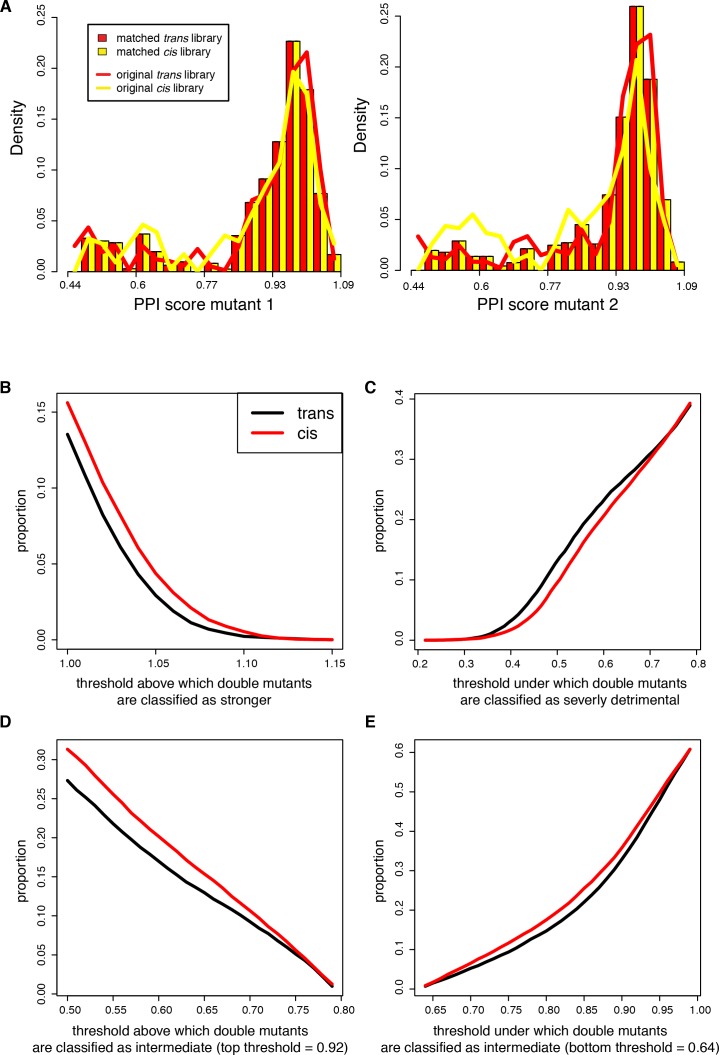
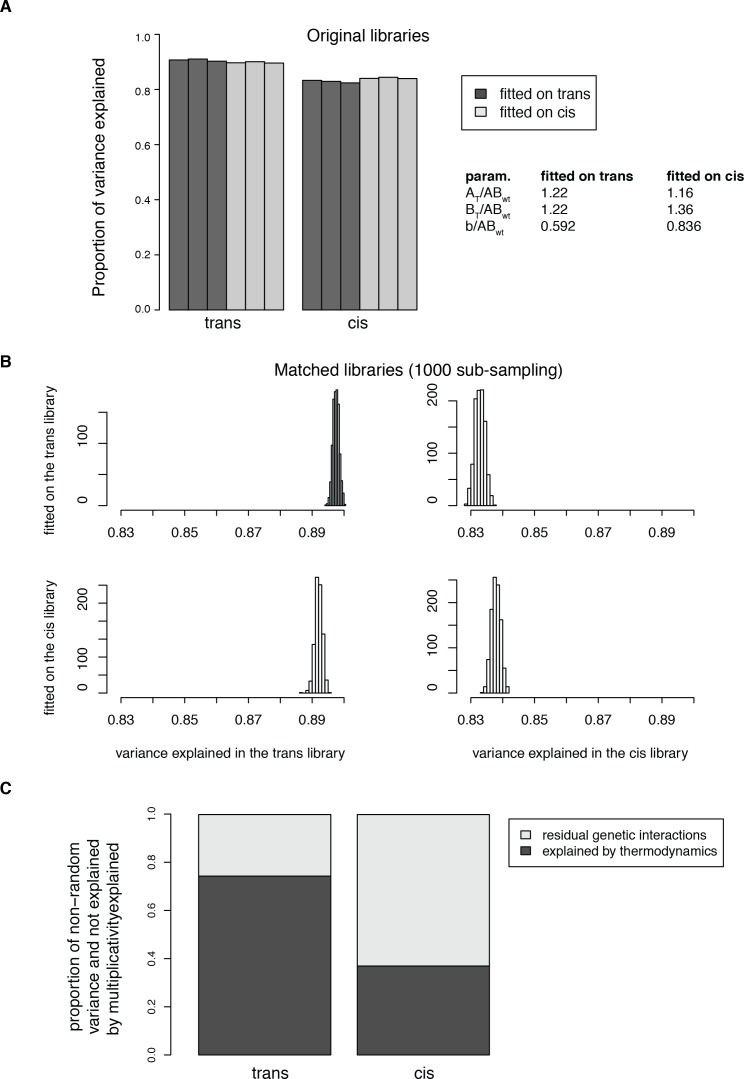
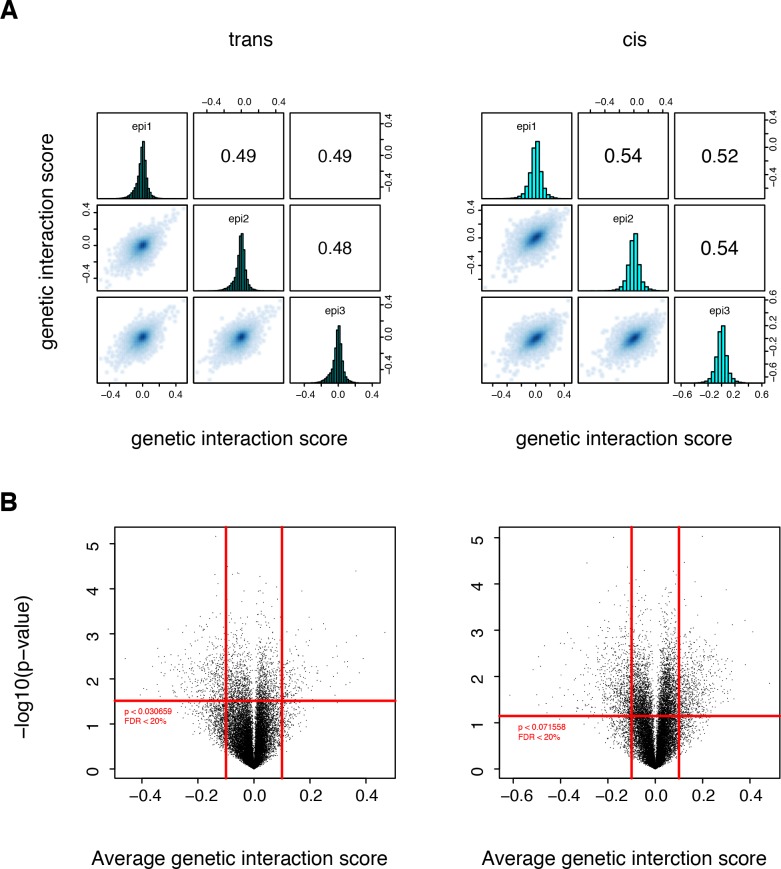
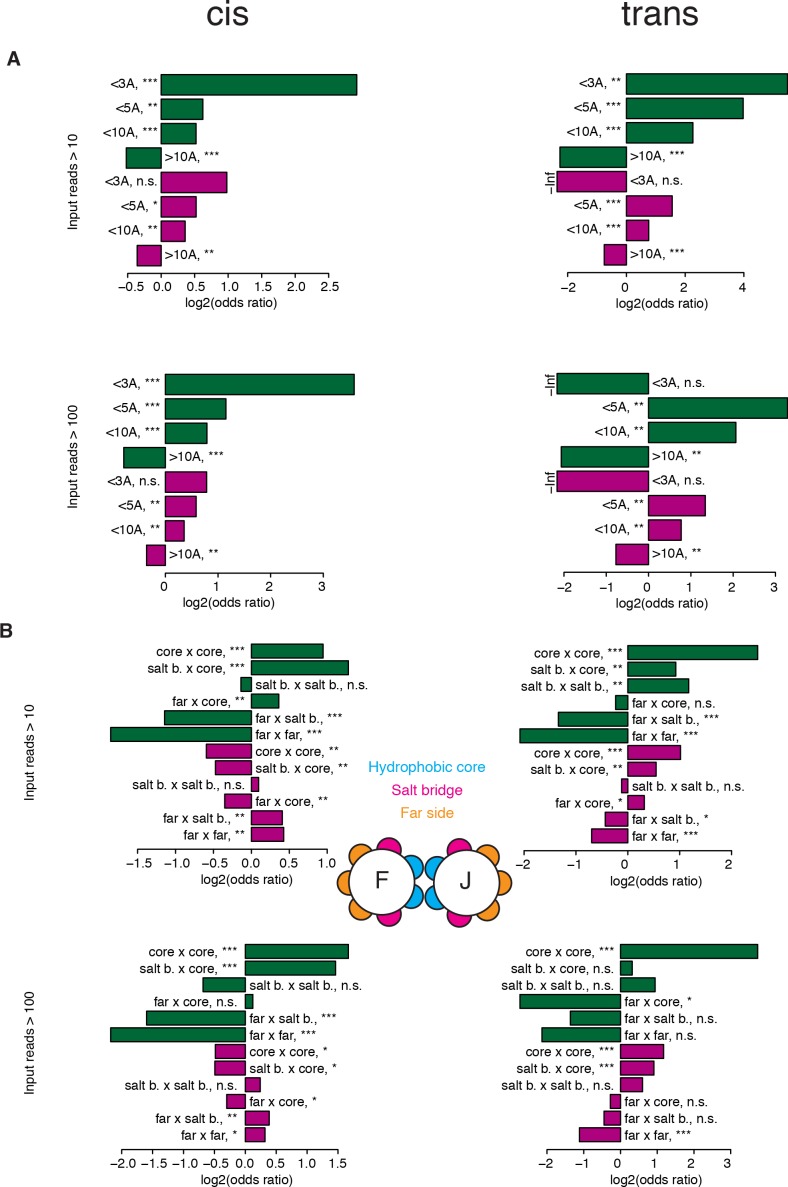
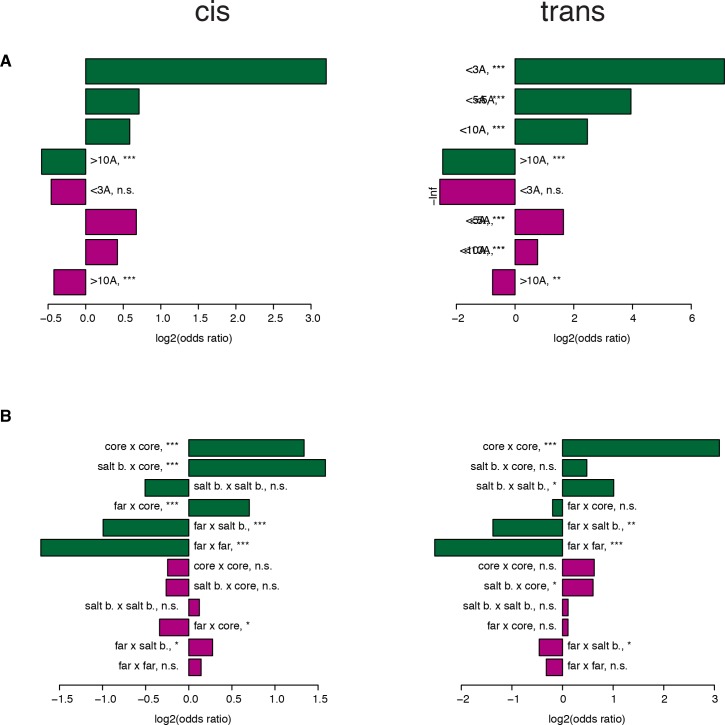
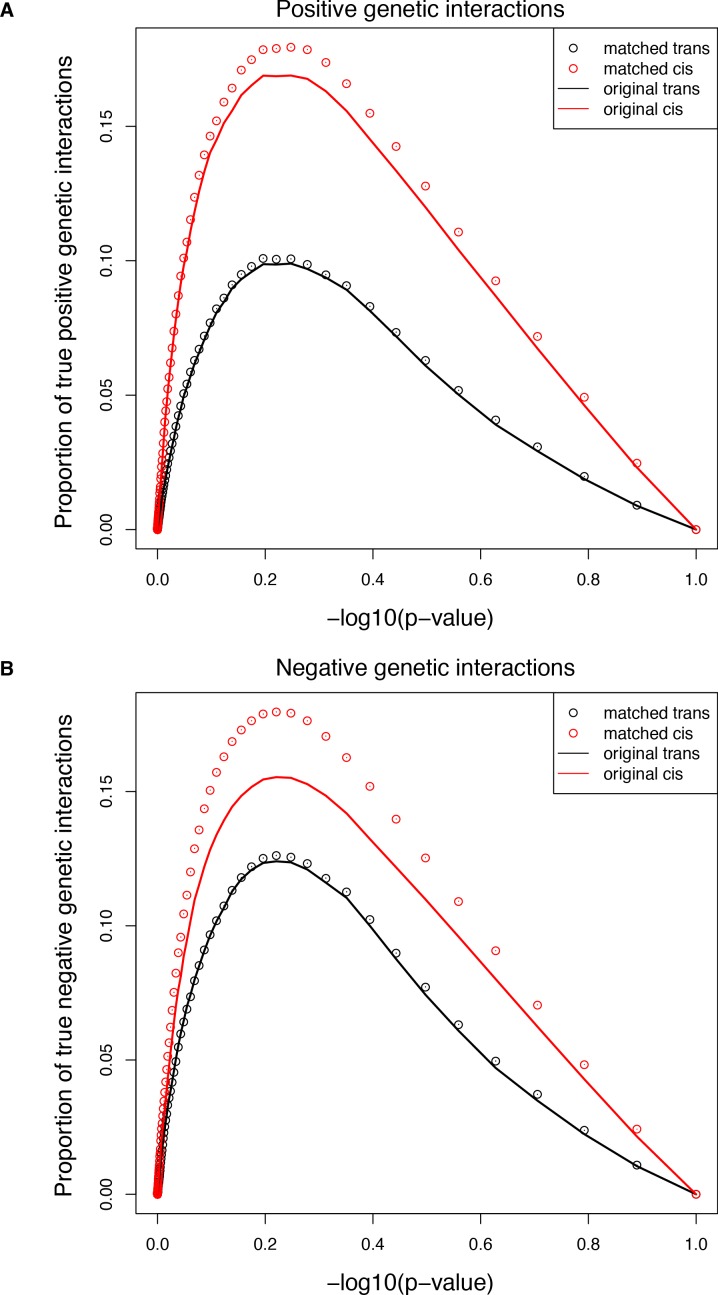
(A) Cartoon illustrating how the cis library differs from the trans one. NNS, whole codon substitution. Asterisk, point mutation. (B) Scatter plot between Average PPI scores of identical pairs of mutations at the same positions in cis and trans. (C) Distribution of double mutants PPI scores in the original cis and trans libraries or after matching their single mutant effects distributions. Error bars represents 95% confidence intervals around the mean of 1000 sub-samplings when matching the two libraries. (D) Stacked bar-plot showing the proportion of the non-random variance in double mutant PPI scores that is not accounted for by the multiplicative model, explained by the thermodynamic model and the residual structural genetic interactions. Error bars represent the standard error of the mean. (E) Proportion of significant positive and negative genetic interactions in the two original libraries. See Figure 5—figure supplements 2, 3, 7 and 9 for sub-sampled libraries with matched single mutant effect distributions.

