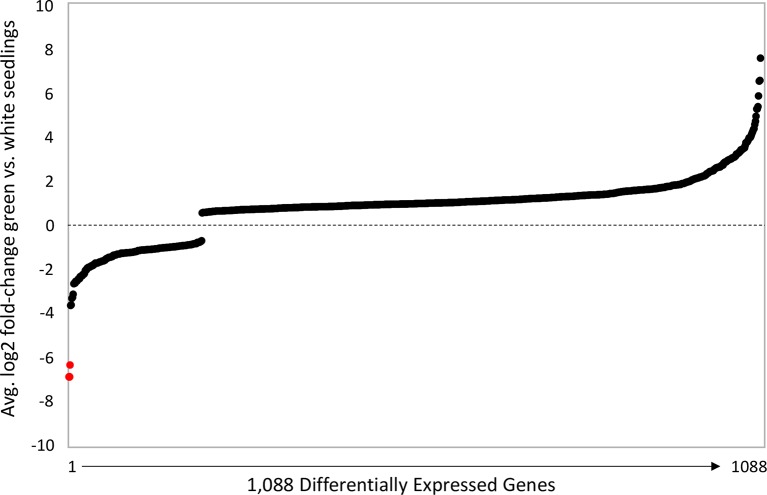
Fig 5. Genome-wide patterns of differential expression.
Average log2 fold-change among the 1,092 genes (representing 3% of annotated genes) that are significantly differentially expressed in all pairwise comparisons of white (F2) and green (DPR102-gutt, DPR104-nas, F2) seedlings. Genes above and below line are over- and underexpressed in white seedlings, respectively. Annotated pTAC14 duplicates are shown as red dots.

