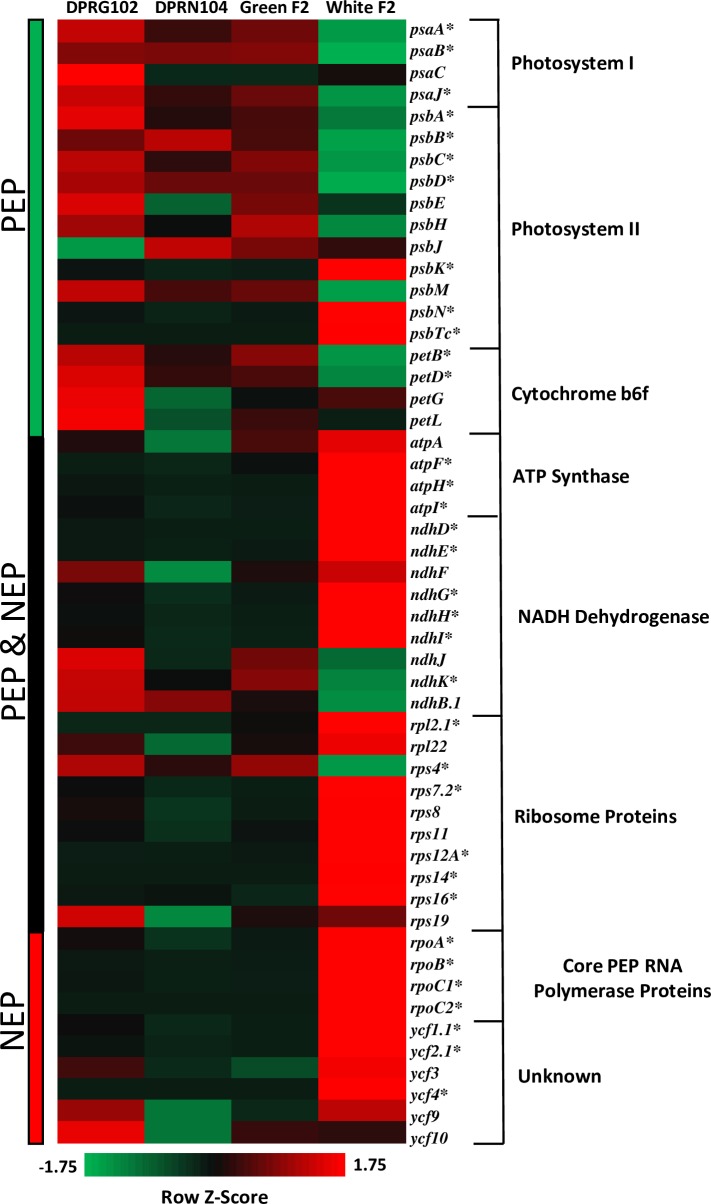
Fig 6. Misexpression of chloroplast genome in white seedlings.
Heat map displaying expression patterns of 52 chloroplast genes from seven chloroplast gene families in seedlings from DPR102-gutt, DPR104-nas, Green F2s and White F2s. Z-scores of normalized FPKM values were calculated for each row to illustrate relative expression differences among genes. Bars on left of heatmap indicate whether genes are primarily transcribed by PEP, PEP and NEP, or NEP RNA polymerases. *denotes genes that are significantly differentially expressed between white seedlings and all green seedlings (DPR102-gutt, DPR104-nas, and Green F2s).

