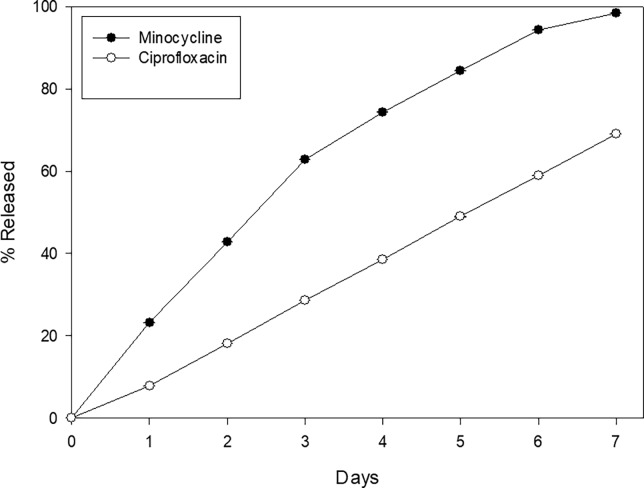
Fig 5. Figure shows the in vitro release of both antibiotics over seven days time span.
Figure shows the in vitro release from nanoparticles of both antibiotics in a time span of seven days. It can be seen that in general, the percentage release of both antibiotics is nearly linear on time, indicating a continuous release. Results are expressed as mean ± SE of the mean.

