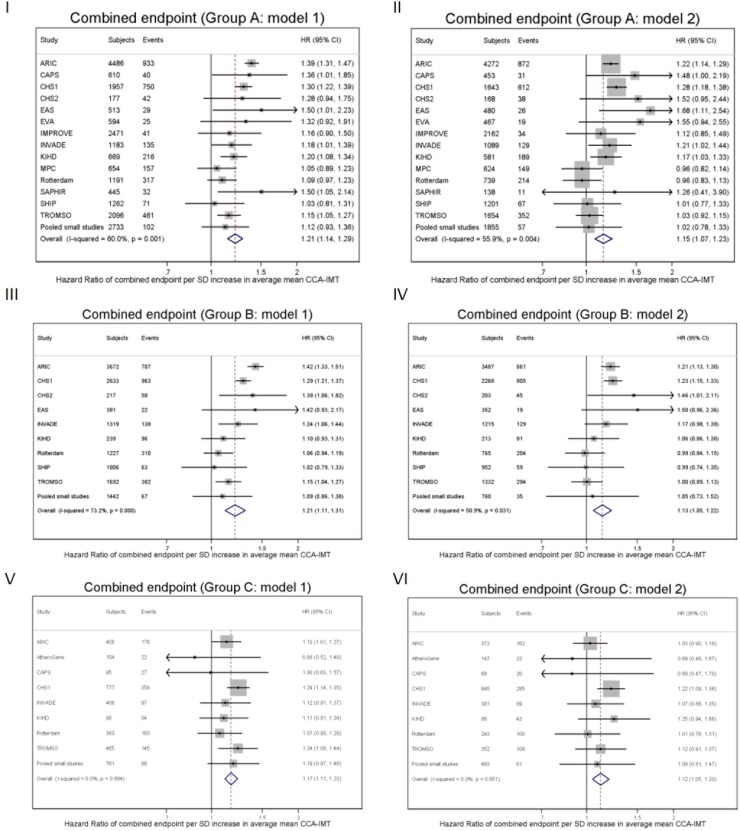
Fig 2. Forest plots of the HR of the combined endpoint per one SD of average mean CCA-IMT (with 95% CIs).
Panel I: Group A (asymptomatic individuals with three or more CVD risk factors), HR adjusted for age, sex and annual mean CCA-IMT change (model 1). Panel II: Group A (asymptomatic individuals with three or more CVD risk factors), HR adjusted for age, sex, annual mean CCA-IMT change and other CVD risk factors (model 2). Panel III: Group B (asymptomatic individuals with carotid plaques), HR adjusted for age, sex and annual mean CCA-IMT change (model 1). Panel IV: Group B (asymptomatic individuals with carotid plaques), HR adjusted for age, sex, annual mean CCA-IMT change and other CVD risk factors (model 2). Panel V: Group C (individuals with previous CVD events), HR adjusted for age, sex and annual mean CCA-IMT change (model 1). Panel VI: Group C (individuals with previous CVD events), HR adjusted for age, sex, annual mean CCA-IMT change and other CVD risk factors (model 2).

