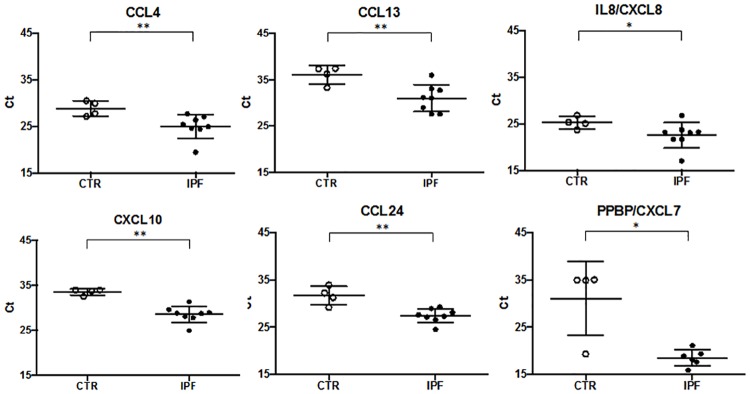
Fig 3. RNA-seq differential gene expression validation by qRT-PCR.
Relative expression of selected chemokines in IPF (N = 7, closed circles) vs. Healthy control (N = 4, open circles) BAL cells represented by normalized ΔCt value. ΔCt value was normalized to the GNB2L1 housekeeping gene expression by subtracting GNB2L1 raw Ct from the selected gene raw Ct and by further adding the absolute GNB2L1 minimum value (the same for all samples) to the gene ΔCt. Lower cycle values correspond to higher expression level. Mann-Whitney test (*) and (**) denote statistical significance (P < 0.05, P < 0.01, respectively) vs. control.

