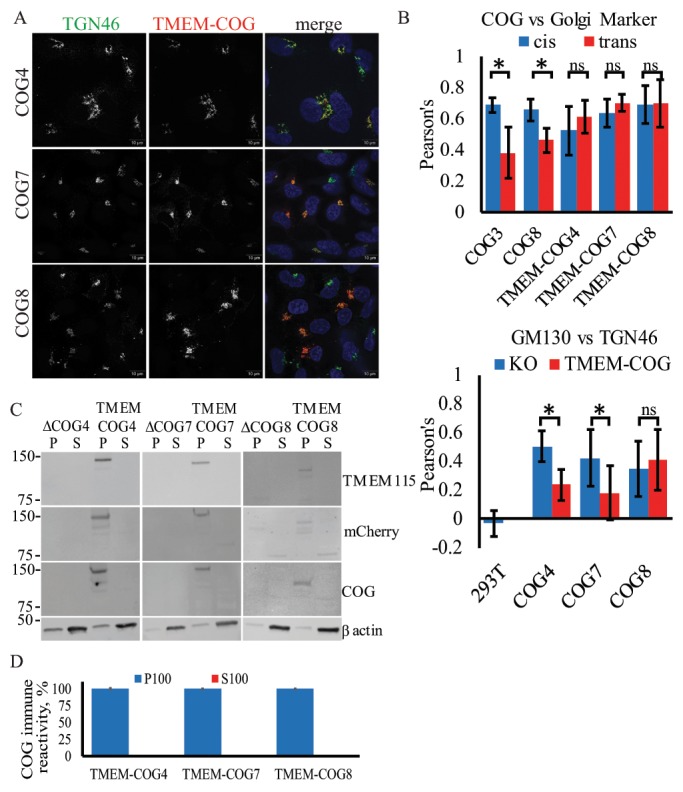
FIGURE 1:

Stable TMEM-anchored COG subunits are Golgi localized and enriched in TGN. HEK293T cells stably expressing TMEM-COG4 in COG4 KO cells, TMEM-COG7 in COG7 KO cells, and TMEM-COG8 in COG8 KO cells. (A) Elyra 3D-SIM superresolution images of TMEM-COG (red), endogenous TGN46 (green), and 4’,6-diamidino-2-phenylindole (DAPI, blue). Maximum intensity projections. (B) Colocalization of COG with Golgi markers. Images were collected and analyzed with LSM880 Airyscan using ZEN colocalization software. At least 20 Golgi were quantified per comparison. Bottom: Colocalization of GM130 and TGN46 in WT, COG KO cells, and stable TMEM-COG cells. Top: TMEM-COG4, TMEM-COG7, and TMEM-COG8 show colocalization with both GM130 (blue) and TGN46 (red). * denotes p < 0.05 in a Student’s t test. Error bars represent SD. (C) Distribution of TMEM-COG in P100 membrane and S100 soluble fractions. Left panels depict COG4 KO and TMEM-COG4 cells probed with antibodies to TMEM115, mCherry, and COG4. Middle panels depict COG7 KO and TMEM-COG7 cells probed with antibodies to TMEM115, mCherry, and COG7. Right panels depict COG8 KO and TMEM-COG8 cells probed with antibodies to TMEM115, mCherry, and COG8. (D) Quantification of COG antibody detection of P100 and S100 on three blots each. No detectable COG in S100 samples.
