FIGURE 1:
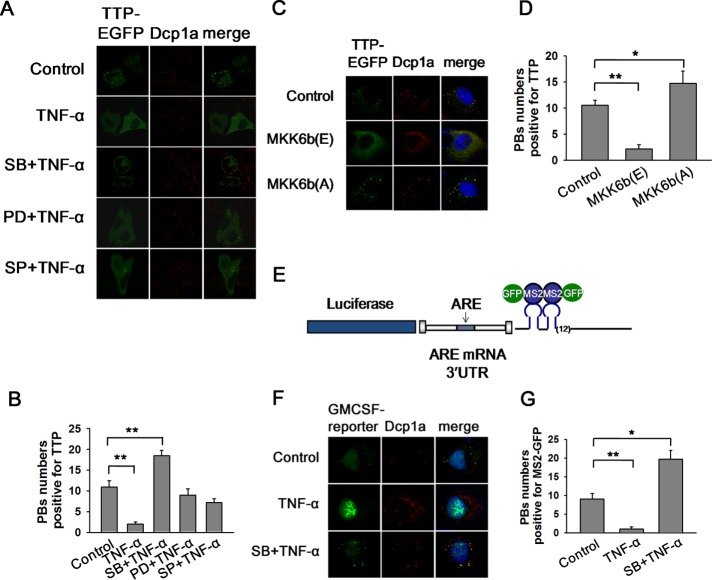
P38 activation promotes the dissociations of TTP and ARE-mRNA from PBs. (A) HeLa cells transiently transfected with TTP-EGFP were pretreated with DMSO (10 μM) as a control or SB (10 μM), PD (30 μM), and SP (50 μM) for 1 h before TNF-α addition (10 ng/ml) for 2 h. PBs were visualized using the anti-Dcp1a antibody. (B) Graph showing the P-body numbers per cell that is positive for TTP as in A. Error bars present SD (n = 30 cells per group). **p ≤ 0.01. (C) HeLa cells were transfected with TTP-EGFP plasmid, together with plasmid expressing MKK6b(E), MKK6b(A), or its empty vector. PBs were displayed with anti-Dcp1a staining. (D) Graph showing the P-body numbers per cell which is positive for TTP as in C. Error bars present SD (n = 30 cells per group). *p ≤ 0.05; **p ≤ 0.01. (E) Schematic of the MS2 system for fluorescence-based mRNA visualization. The mRNA containing MS2 sites present downstream of the ARE-containing GM-CSF 3′ UTR is bound by GFP-tagged MS2-binding protein, allowing fluorescent visualization of the mRNA. (F) HeLa cells were transfected with the MS2 dual plasmid system using the luciferase-GM-CSF 3′ UTR mRNA expression constructs, along with MS2-GFP. MS2-GFP was used to visualize mRNA. Cells were cultured in media alone (Control), treated for 2 h with TNF-α (10 ng/ml), and pretreated with SB (10 μM) for 1 h before TNF-α addition (10 ng/ml). PBs were visualized using anti-Dcp1a antibody. Results shown are representative of those from three experiments. (G) Graph showing the P-body numbers per cell that is positive for MS2-GFP. Error bars present SD (n = 30 cells per group). *p ≤ 0.05; **p ≤ 0.01.

