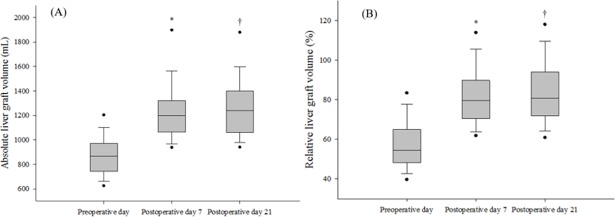
Fig 2.
Changes in (A) absolute liver graft volumes (mL), and (B) relative liver graft volumes (%), preoperatively versus days 7 and 21 postoperatively, in patients who underwent living donor liver transplantation. The box plots show the median (line in the middle of the box), interquartile range (box), 5th and 95th percentiles (whiskers), and outliers (dots). *p < 0.001, preoperatively vs. postoperative day 7. †p < 0.01, postoperative day 7 vs. day 21.

