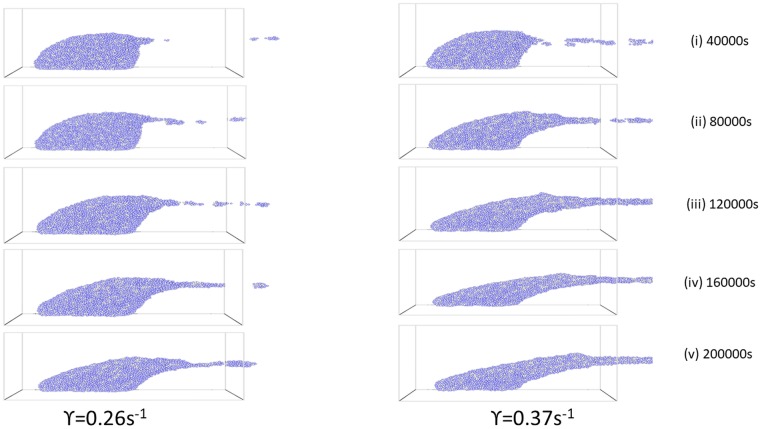
Fig 1. Biofilm structures showing temporal evolution of effect of shear rate on biofilm deformation and bacteria detachment for different shear rates for the period the flow is applied.
Left-plot: γ = 0.26s−1 and right-plot: γ = 0.37s−1 for 40,000, 80,000, 120,000, 160,000 and 200,000 seconds respectively.

