. 2018 Mar 21;7:e34271. doi: 10.7554/eLife.34271

Figure 4. Kinetic analysis of HIV-1 Env binding to CD4.

Differences in free energies (ΔG°ij) between the FRET states, and the changes in activation energies (ΔΔGij) arising from sCD4 and sCD4D1D2-Igαtp binding to (A) HIV-1NL4-3 (B) HIV-1JR-FL and (C) HIV-1BG505. ΔG°ij values were calculated from the occupancies of each FRET state in the FRET histograms. ΔΔGij values were calculated from the rate constants for the observed transitions for the unliganded (black), sCD4-bound (green) and sCD4D1D2-Igαtp-bound (blue) HIV-1 Env. The dotted arrow lines indicate the actual ΔΔGij of the forward and backward transitions while the solid line in between indicate the averaged value of the two. Energies are displayed in units of kBT, where kB is Boltzmann constant, and T is temperature.

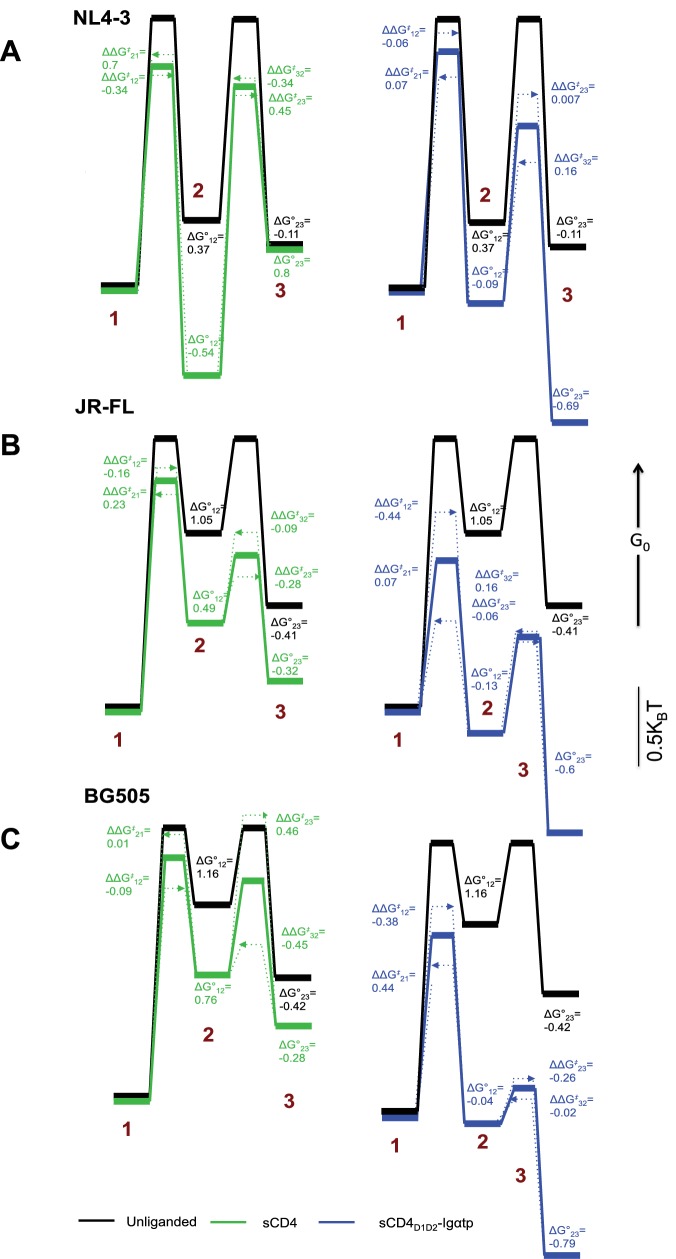
Figure 4.

Figure 4—figure supplement 1. Survival probability distributions for transitions observed in HIV-1NL4-3 Env.

Figure 4—figure supplement 1.

(A–C) Survival probability distributions (gray) for each transition for the unliganded (A), sCD4-bound (B), and sCD4D1D2-Igαtp-bound (C) HIV-1NL4-3 Env. Each distribution was fit to the sum of two exponential distributions (y = A1 exp k1t + A2 exp k2t) (red). R2 of curve fitting was indicated in each panel.
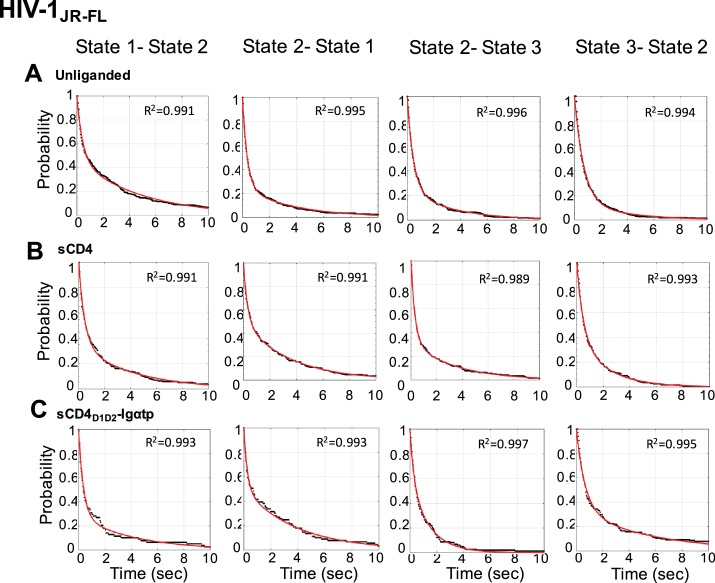
Figure 4—figure supplement 2. Survival probability distributions for transitions observed in HIV-1JR-FL Env.

Figure 4—figure supplement 2.

Survival probability distributions as in Figure 4—figure supplement 1 for HIV-1JR-FL Env.
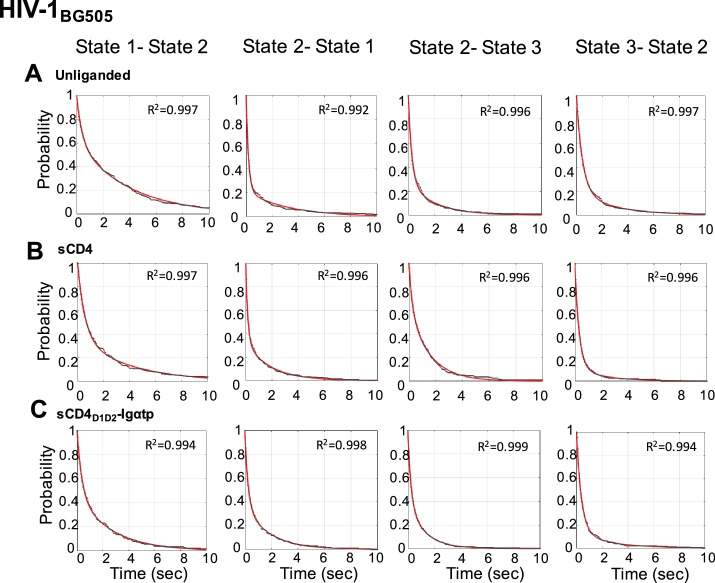
Figure 4—figure supplement 3. Survival probability distributions for transitions observed in HIV-1BG505 Env.

Figure 4—figure supplement 3.

Survival probability distributions as in Figure 4—figure supplement 1 for HIV-1BG505 Env.