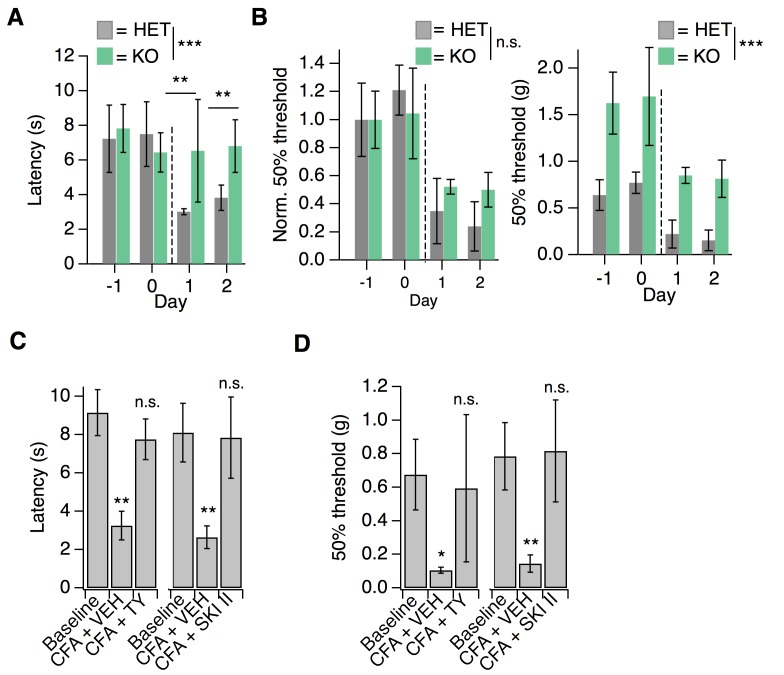
Figure 7. S1PR3 is dispensable for development of chronic mechanical hypersensitivity.
(A) Thermal latency before and after CFA treatment (indicated by dotted line); pgenotype = 0.0053 (two-way ANOVA; N = 5 mice per genotype). Sidak’s multiple comparison between genotypes for specific time points indicated on graph. Error bars represent mean ± SD. (B) (Left) Normalized 50% withdrawal threshold before and after CFA treatment (indicated by dotted line); p(genotype)<0.001 (two-way ANOVA). (Right) 50% withdrawal thresholds for same experiment (p(genotype)=0.1634; two-way ANOVA). (C) (Left) Thermal latency assessed before (‘Baseline’) and 24 hr post CFA injection with either vehicle (CFA + VEH) or TY 52156 (CFA + TY) acutely administered; p<0.0001 (one-way ANOVA N = 5 mice per treatment). (Right) Thermal latency assessed before and after CFA injection with either vehicle (CFA + VEH) or SKI II (CFA + SKI II) acutely administered on Day 1; p<0.0001 (one-way ANOVA; N = 5–7 mice per treatment). Dunnett’s test comparisons to baseline are indicated on graph. Error bars represent mean ± SD. (D) (Left) 50% withdrawal threshold assessed before and 24 hr post CFA injection with either vehicle (CFA + VEH) or TY 52156 (CFA + TY) acutely administered on Day 1; p<0.0001 (one-way ANOVA; N = 5 mice per treatment). Dunnett’s test comparisons to baseline are indicated on graph. (Right) 50% withdrawal threshold assessed before and 24 hr post CFA injection with either vehicle (CFA + VEH) or SKI II (CFA + SKI II) acutely administered; p-values indicated on graph (two-tailed unpaired t-test; N = 5 mice per group.


