. 2018 Apr 9;7:e32293. doi: 10.7554/eLife.32293

Figure 3. AIM-100 causes formation of DAT nanoclusters on the plasma membrane.

(A) Time-lapse TIR-FM imaging of PAE/YFP-HA-DAT cells. Individual time frames before and 45 min after addition of AIM-100 (20 µM) are shown. (See Figure 3—video 1). Insets below represent high magnification images of the regions marked by white rectangles. Scale bars are 5 µm in images and 2 µm in insets. (B) The number of YFP-HA-DAT puncta in cells treated with AIM-100 was calculated as described in ‘Materials and methods’ in nine time-lapse TIR-FM imaging sequences represented in (A). Mean values (±S.D.) of the percentage of maximum number of puncta per time frame are presented. (C) Representative kymographs time-series of YFP-HA-DAT imaging from randomly-selected region of cells presented in (A). Examples of stable clusters are indicated by white arrows. Examples of shorter-living clusters that may represent vesicle scission events are shown by red arrows. (D) High magnification time-lapse images (0–18 min with AIM-100) of the region marked by red rectangles in (A) demonstrating clustering of YFP-HA-DAT in a filopodium. (E) Cell were incubated with AIM-100 for 45 min as in (A), and 3D stack of confocal images were acquired. Insets show high magnification images of regions of the bottom and top of the cell (above nucleus) indicated by white rectangles.

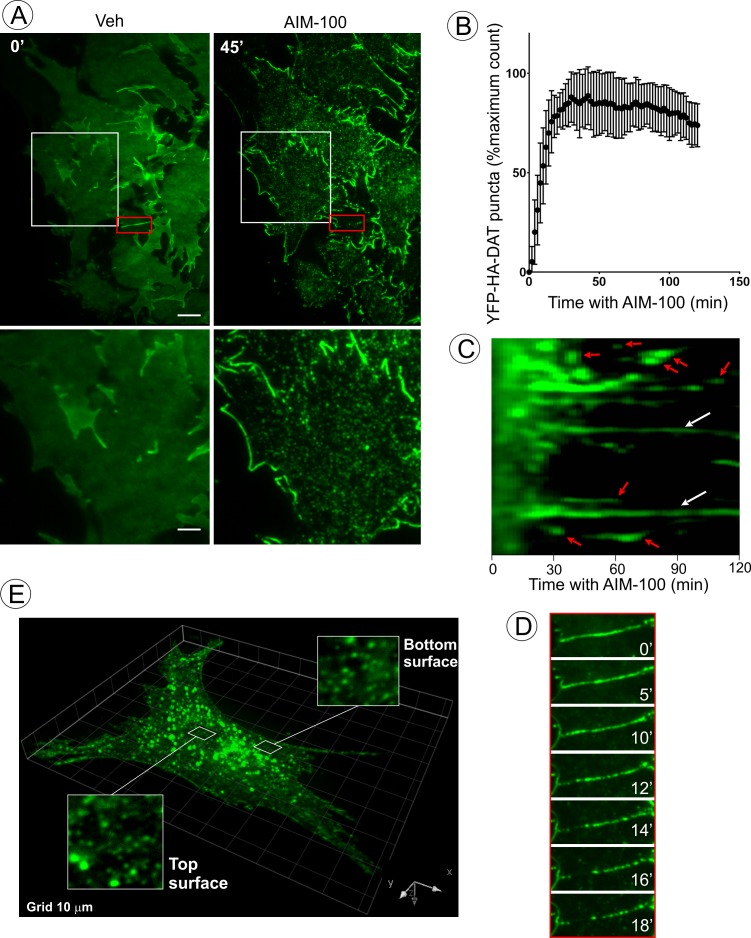
Figure 3.

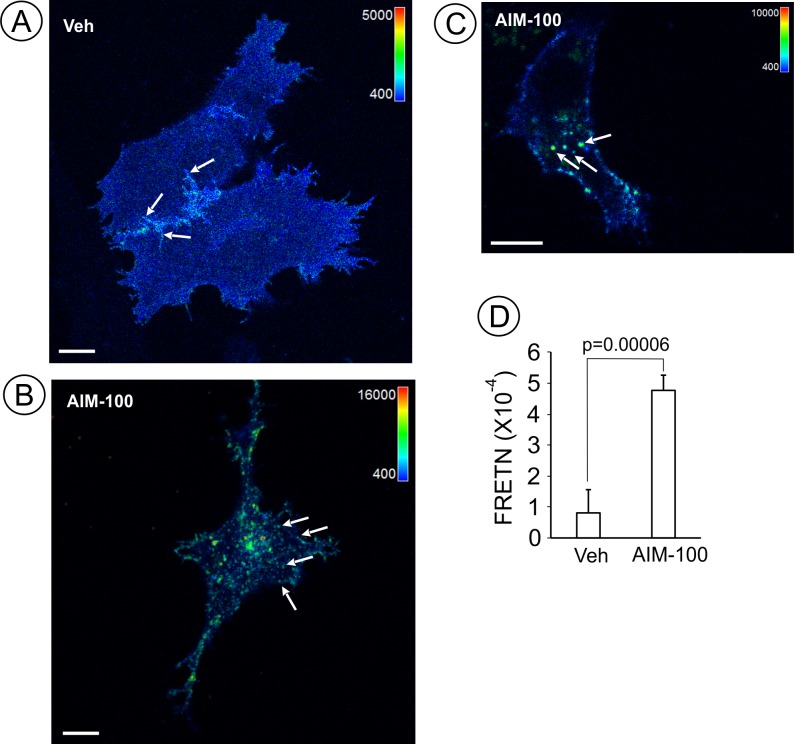
Figure 3—figure supplement 1. AIM-100 increases FRET between CFP- and YFP-DATs.

Figure 3—figure supplement 1.

PAE cells stably co-expressing CFP-DAT and YFP-DAT were incubated with DMSO (veh) (A) or 20 µM AIM-100 (B–C) for 90 min at 37°C, and FRET imaging was performed at room temperature (20°C). FRETC images were calculated as described in ‘Methods’ and are presented as pseudocolor intensity-modulated images (FRETC/CFP). FRETC image in (B) is through the bottom cell membrane to visualize FRET in plasma membrane clusters, whereas an image in (C) is through the perinuclear area of the cell where many endosomes are located. Note different FRETC intensity scales in images of vehicle- and AIM-100-treated cells, reflecting increased FRETC signals in the latter cells. The intensity scales of the CFP fluorescence are the same in all three images. Arrows show examples of filopodia, plasma membrane clusters and endosomes that were used as sub-regions for calculations of FRETN values in (D). Scale bars, 10 µm. (D) Bar graph represents mean FRETN values of individual cell regions, structures and compartments measured in vehicle- and AIM-100-treated cells (±SEM; n = 21–37). A.l.u.f.i, arbitrary linear units of fluorescence intensity. P values were calculated for ‘AIM-100’ versus ‘vehicle’.
Figure 3—video 1. Time-lapse TIR-FM imaging of PAE/YFP-HA-DAT cells.
Download video file (1.4MB, mp4)
DOI: 10.7554/eLife.32293.008
AIM-100 (20 µM) was added at time point ‘0’. Imaging intervals 2 min. Total time – 120 min.