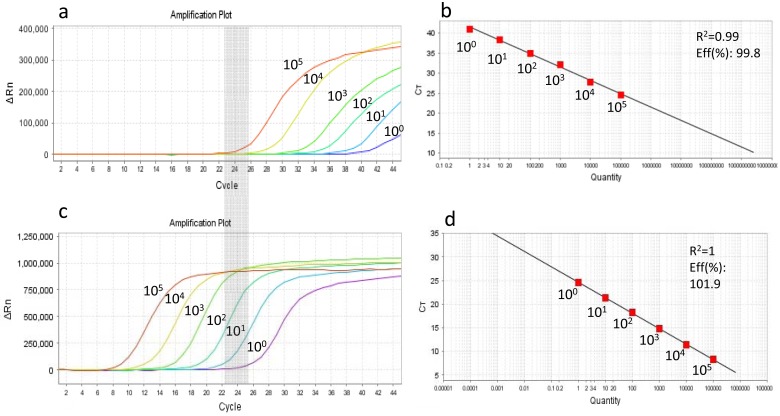
Fig 1. Comparison of reverse transcriptase-based single round qPCR (a and b) and sn-qPCR (c and d) assays designed to quantify subtype C HIV-1 proviral DNA.
Amplification curves (a and c) of ten-fold diluted plasmid (p8MJ4) DNA harboring subtype C HIV-1 gag-pol gene and standard curves generated (b and d) from respective curves. Grey zone shows that the cycle threshold (CT) region where 105 plasmid DNA copies are amplified in the single round qPCR (a) is equivalent to the CT region where a single copy (10°) is amplified using the sn-qPCR assay. Eff = PCR efficiency.

