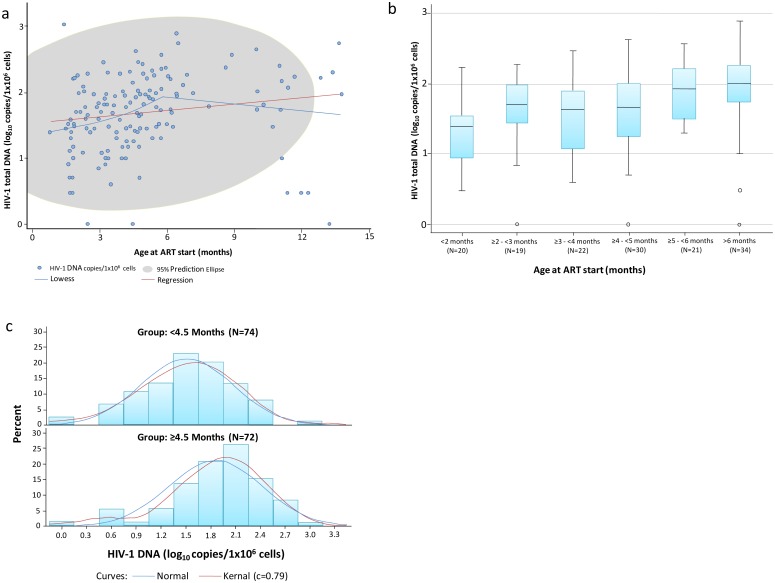
Fig 2. Associations between age at starting ART and cell-associated HIV-1 DNA levels after a median of 4.3 years of treatment among 146 HIV-infected children.
a: Scatterplot of HIV-1 DNA log10 copies/106 cells (Y-axis) by age at ART start in months (x-axis). LOcally WEighted Scatter-plot Smoother (LOWESS) and linear regression prediction lines are shown in blue and red, respectively; and the grey area shows the 95% prediction elipse. b: Box and whisker plot of HIV-1 DNA log10 copies/106 cells by age at ART start groups; c: Histograms and estimated normal and kernel distributions of HIV-1 DNA log10 copies/106 cells among those who started ART <4.5 and ≥4.5 months of age.

