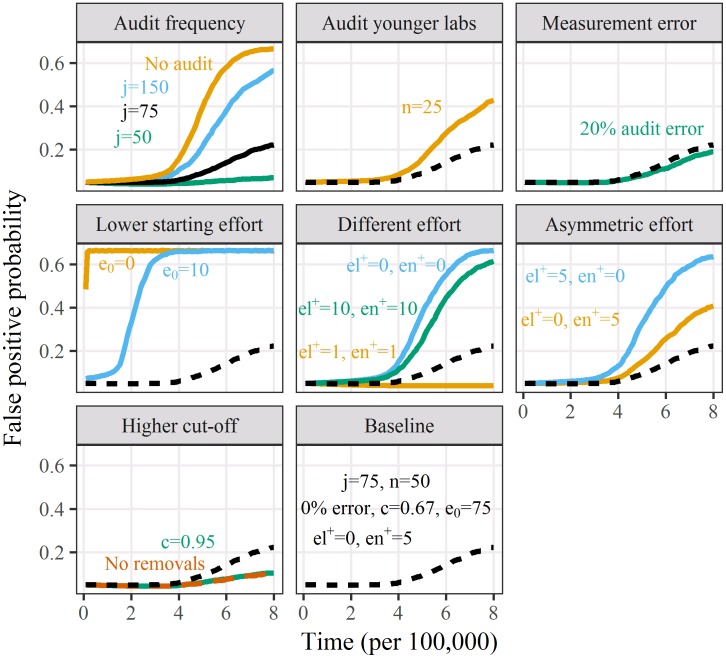
Fig 3. Mean false positive probabilities for 100 labs over time (research cycle) for the sensitivity analyses.
j = 75 cycle per audit (Auditing 1.35% of all papers) is the baseline scenario with: starting effort e0 = 75; increased effort after auditing el+ = en+ = 5; percentile cut-off for lab removal c = 0.67; minimum papers n = 50; review error = 0%. All other results change one of these six parameters. The baseline scenario is shown as a dashed line in all the panels bar the top-left panel where it is a solid line.

