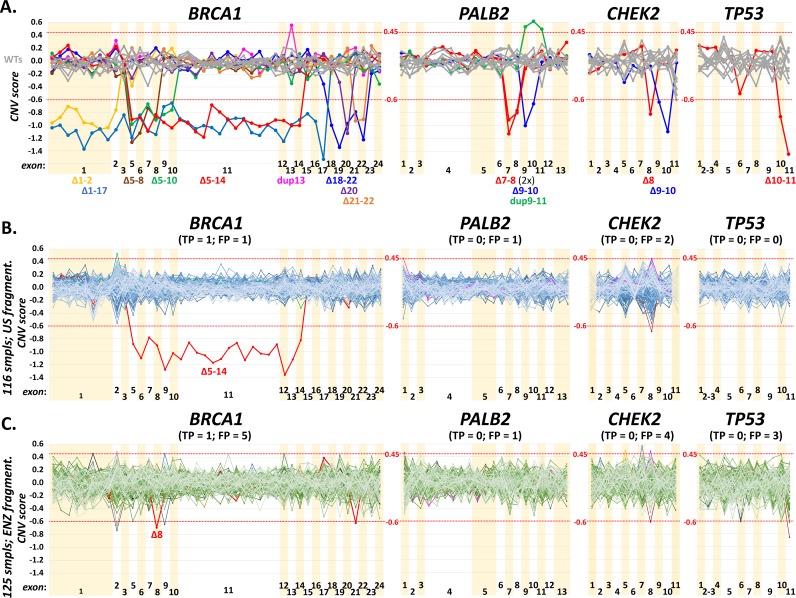
Fig 5.
The panel A show results of CNV analysis revealing large deletions or duplications in four genes in a testing set of 35 samples with previously identified CNVs. The charts show median-normalized values of CNV scores for particular gene bins (default settings in CNVkit software; S8 Table). Values <-0.6 and >0.45 (red dotted lines) were assumed as thresholds indicating a deletion or a duplication, respectively. All shown CNVs were confirmed by MLPA previously (S7 Table). The panels B and C demonstrate frequency of true positive (TP) and false positive (FP) CNV signals from analyses performed in two participating laboratories (laboratory 1 in B and laboratory 3 in C). While 116 samples analyzed in four consecutive runs in B were prepared using the ultrasound (US) fragmentation, 125 other samples in four consecutive runs in C were prepared using the enzymatic (ENZ) fragmentation method. Samples in vivid colors highlight suspected samples that were further analyzed by MLPA analysis and samples in BRCA1 Δ5–14 (B) and Δ8 (C) denote for true positives. The presence of putative CNVs in PALB2, CHEK2, and TP53 were excluded by analysis that revealed heterozygotes in regions with suspected deletions or by an MLPA analysis.

