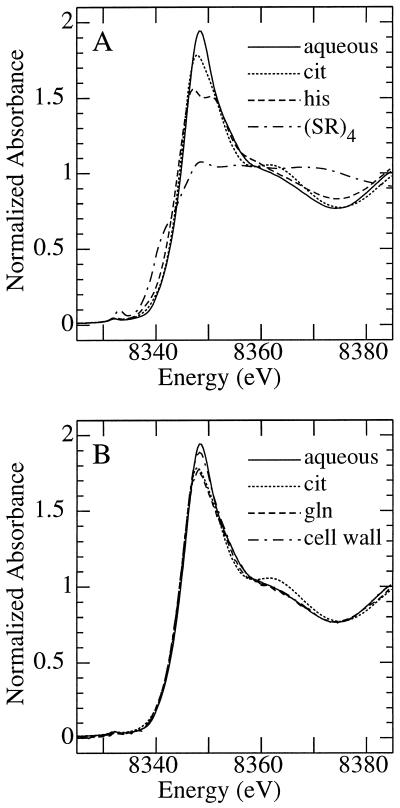
Figure 3.
X-ray absorption near-edge spectra of selected aqueous Ni species recorded at the Ni K-edge. The order of spectra plotted at the edge, from top to bottom, is as follows: A, Aqueous Ni2+ (6.66 mm Ni[NO3]2, pH 7.0), Ni-citrate (6.66 mm Ni[NO3]2 and 70 mm citrate, pH 8.0), Ni-His (6.66 mm Ni[NO3]2 and 80 mm His, pH 7.0), and (Ni[SPh]42−; Eidsness et al., 1989). B, Aqueous Ni2+ (6.66 mm Ni[NO3]2, pH 7.0), isolated T. goesingense shoot cell wall material (Lasat et al., 1996), Ni-citrate (6.66 mm Ni[NO3]2 and 70 mm citrate, pH 8.0), and Ni-Gln (1 mm Ni[NO3]2 and 4 mm Gln, pH 7.3).

