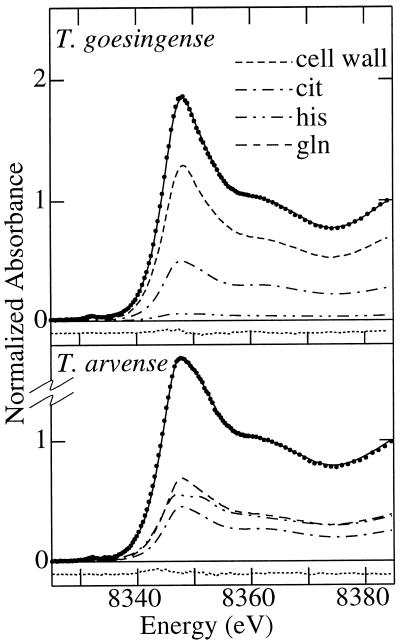
Figure 5.
Results of quantitative modeling of x-ray absorption near-edge spectra obtained from shoots of T. goesingense and T. arvense. The spectrum of a mixture of Ni complexes is the sum of the spectra of all constituent complex species scaled by their relative proportional contribution to overall Ni chelation. By fitting spectra of aqueous Ni, Ni coordinated with His (6.66 mm Ni[NO3]2, 80 mm His, and 30% [v/v] glycerol, pH 7.0), citrate (6.66 mm Ni[NO3]2, 70 mm citrate, and 30% [v/v] glycerol, pH 8.0), Gln (1 mm Ni[NO3]2, 4 mm Gln, and 30% [v/v] glycerol, pH 7.3), and isolated T. goesingense shoot cell wall material (Lasat et al., 1996), we were able to determine the relative contribution of each compound as a ligand of Ni in planta (Fig. 1). A, T. goesingense shoots; relative goodness of fit of 0.06 × 10⁻³. B, T. arvense shoots; relative goodness of fit of 0.1 × 10⁻³. The figure shows the data (points), the best fit (solid line) and the residual (dotted line), together with the individual fractional contributions. The goodness of fit is defined as Σ[(Iobsd. − Icalcd.)2 ]/n, where n is the number of points in the spectrum and Iobsd. and Icalcd are the observed and calculated points, respectively.

