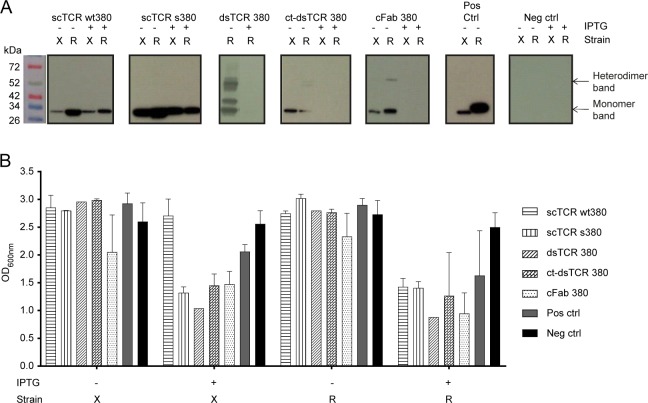
Fig 2. Effect of host strain and induction conditions on periplasmic TCR expression.
(A) Representative western blots showing the expression profile of the TCR formats in either E. coli XL1-Blue (X) or RosettaBlueTM (R) where IPTG induction of protein expression either was omitted (-) or included (+). Normalized expression cultures were fractionated before the presence of TCR in the periplasmic fractions was analyzed by western blot detection using an anti-His-HRP antibody (n = 3). (B) The bacterial growth characteristics were monitored by measuring the OD600nm of E. coli XL1-blue (X) and RosettaBlueTM (R) bacterial cultures after overnight protein expression without (-) or with (+) IPTG induction at 30°C. n = 3 for all constructs except for controls (n = 4) and the dsTCR constructs (n = 1). Standard deviations are indicated where possible. (A, B) Cells expressing scFv anti-phOx were used as positive control and untransformed cells as negative control.

