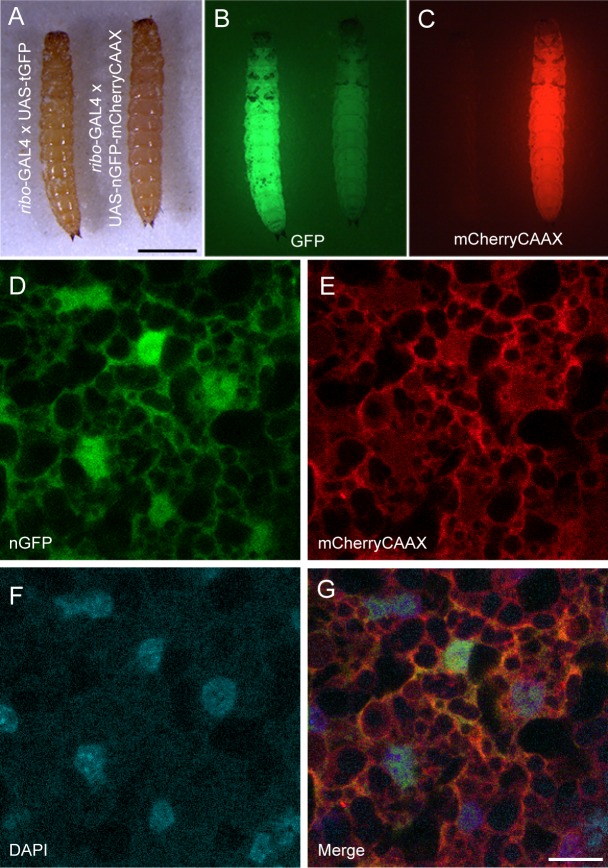
Fig 1. Characterization of GAL4 and UAS vectors.
(A-C) Tribolium larvae expressing either GFP (left) or nls-EGFP-T2A-mCherryCAAX (right) driven by ribo-GAL4. (A) White light illumination; (B) GFP illumination. The nls-EGFP signal is not detectable as compared to cytoplasmic GFP. (C) mCherry illumination. Scale bar = 1 mm. The mCherry illumination mimics the cytoplasmic GFP expression. (D-G) Images of fat cells expressing nls-EGFP (D) and mCherryCAAX (E), counterstained with DAPI (F), and the merge of the three labels (G). Each represents a single confocal section. Scale bar = 10 μm.

