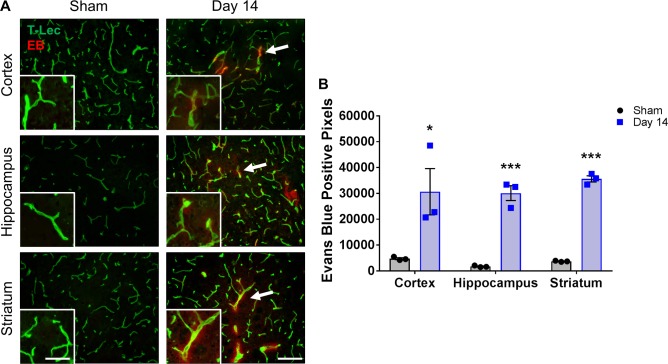
Fig 3. Leakage of Evans blue from blood vessels is observed in multiple regions of the brain following BCAS.
A) Representative images of Evans blue (EB) staining (red) co-labeled with tomato-lectin (green) within the cortex, hippocampus and striatum of sham or BCAS-treated (14 days) mice. Scale bar = 100 um. Inset images are a magnified portion to show detail. Scale bar = 300 um. White arrows indicate example regions of Evans blue leakage from the endothelial cells. B) Quantification of Evans blue-positive pixels. N = 3 *p < 0.05, ***p < 0.001.

