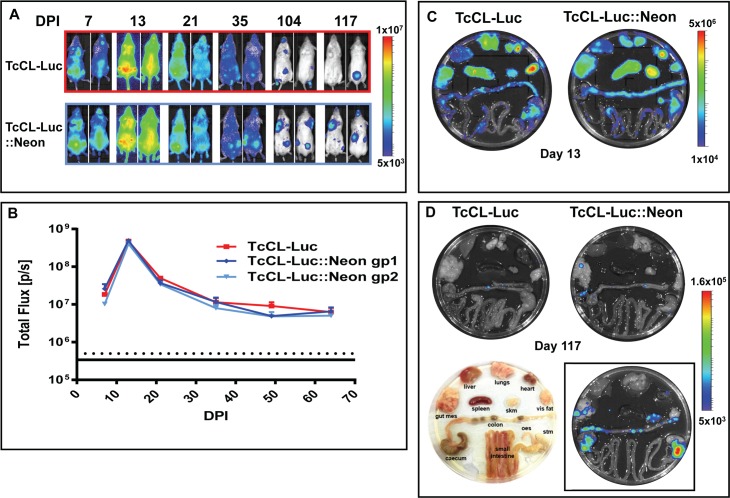
Fig 2. Expression of the dual reporter does not impinge on the infection profile.
A. Bioluminescence imaging of representative infected mice (ventral and dorsal images shown) following i.p. infection with 1x10³ bloodstream trypomastigotes; upper panel, infection with the original T. cruzi CL-Luc clone; lower panel, infection with the T. cruzi CL-Luc::Neon clone. DPI; days post-infection. B. The total body flux for each group in photons/second (p/s). Data points represent the sum of the total flux from both dorsal and ventral views. Red line, group infected with T. cruzi CL-Luc; Blue lines, two individual groups infected with T. cruzi CL-Luc::Neon (n = 3 per group). Error bars represent SEM. C. Post mortem imaging of organs from mice in the acute phase of infection (day 13). D. Organs imaged in the chronic phase of infection (day 117). The image in the lower panel (left) indicates the arrangement of tissues. The image inset in the lower panel (right) shows organs from the chronic phase of infection (day 117) from a mouse immunosuppressed with cyclophosphamide (Methods), that was infected with T. cruzi CL-Luc::Neon. All images in D are calibrated to the same scale as indicated by the side bar.

