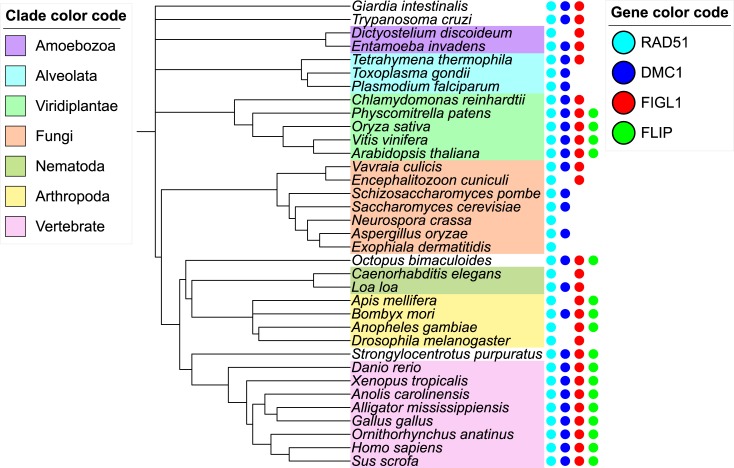
Fig 3. Phylogenetic tree depicting the evolutionary conservation of FLIP, FIGL1, RAD51 and DMC1 orthologs in a range of eukaryotic species.
FLIP, FIGL1, DMC1 and RAD51 are presented as dots in green, red, blue and turquoise color, respectively. Gene accession numbers are provided in S2 Table. A version of this figure with a larger number of species can be found in S3 Fig and as an interactive tree at http://itol.embl.de/tree/132166555992271498216301.

