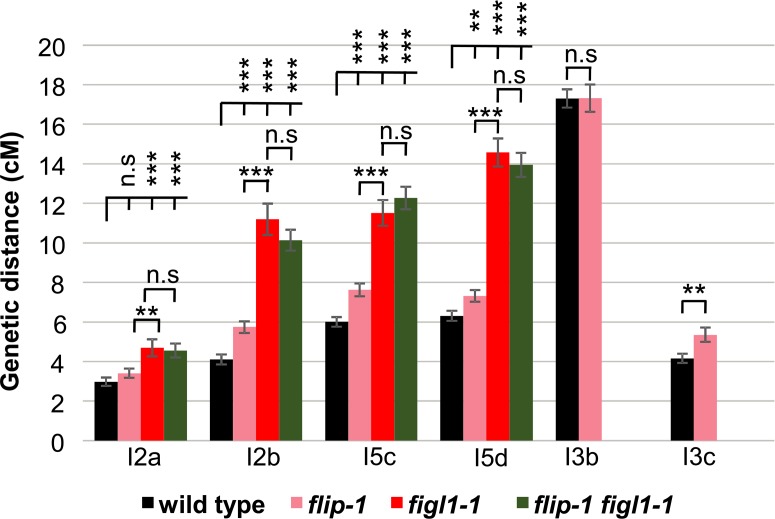
Fig 5. FLIP and FIGL1 act in the same pathway to limit COs.
Genetic distance in centiMorgan (cM) measured by pollen tetrad analysis using fluorescent tagged lines [43]. I2a and I2b are adjacent intervals on chromosome 2. Similarly I3bc and I5cd on chromosome 3 and 5, respectively. Error bar indicates ± standard error of the mean. Not significant (n.s) p > 0.05; ** p < 0.01; *** p < 0.001, Z-test. Raw data are presented in S3 Table.

