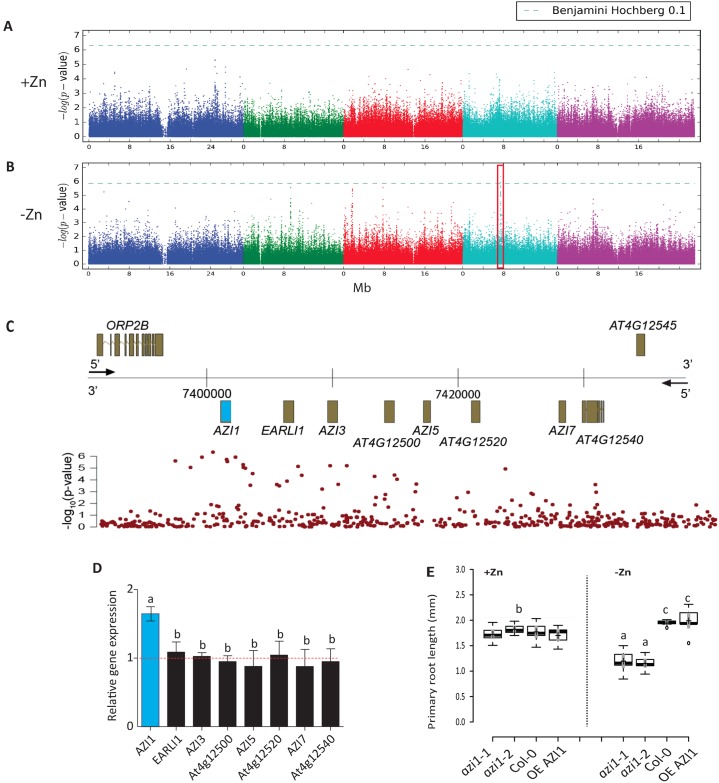
Fig 1. AZI1 controls root growth under zinc limiting conditions.
GWAS for mean root length based on a set of 231 A. thaliana accessions grown under (A) zinc sufficiency (+Zn) or (B) low zinc (-Zn) (day 2). The chromosomes are represented in different colors. The horizontal dash-dot line corresponds to a FDR of 10% after Benjamini–Hochberg–Yekutieli correction. The red box indicates the significant association. (C) Genomic region around AZI1 locus (highlighted in blue). X-axis: genomic position. Y-axis: upper panel: Gene models. Lower panel: LOD score from GWAS depicted in (B). (D) Expression changes (fold change) of AZI1, EARLI1, AZI3, At4g12500, AZI5, At4g12520, AZI7 and At4g12540 in Col-0 grown in –Zn conditions compared to Col-0 plants grown under +Zn conditions. Every data point was obtained from the analysis of roots collected from a pool of ten plants. Error bars correspond to s.d.; three biological repeats. The Ubiquitin gene was used as an internal reference. (E) Average primary root length (Day 2) of wild-type plants (Col-0 genotype), azi1 mutant and overexpressor line 35S::AZI1 (OE AZI1) plants grown under +Zn or –Zn respectively. Crosses show sample mean; center lines show sample medians; box limits indicate the 25th and 75th percentiles as determined by R software; whiskers extend 1.5 times the interquartile range from the 25th and 75th percentiles. Outliers are represented by dots. Shaded central region show confidence intervals of means. This graph was generated by BoxPlotR: a web-tool for generation of box plots [15]. Experiments were independently repeated three times, and data are represented as mean ± s.d. n = 10. Letters a, b and c indicate significantly different values at p <0.05 determined by one-way ANOVA and Tukey HSD.

