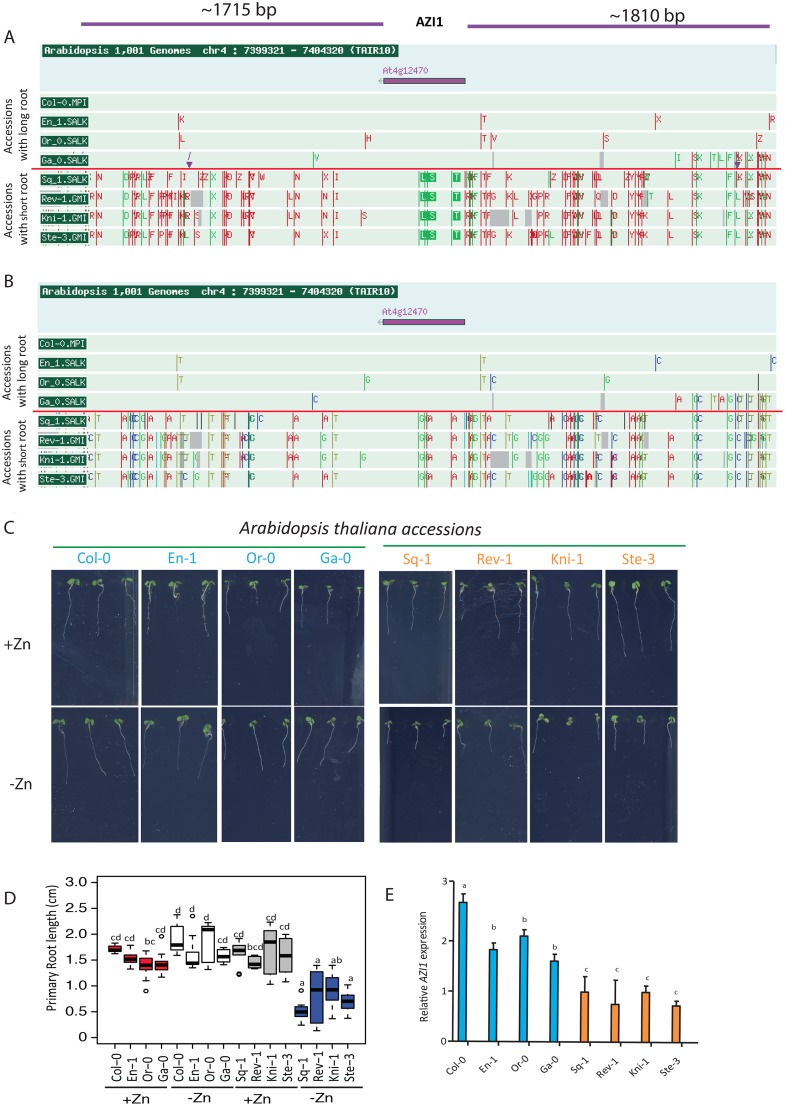
Fig 2. Polymorphism patterns around the AZI1 locus in extreme accessions.
(A, B) Gene models and SNP polymorphisms among representative extreme accessions (4 accessions with short root phenotype in -Zn and 4 accessions with long root phenotype in -Zn) for the genomic region surrounding the AZI1 gene (~1810 bp upstream and ~1715 bp downstream the start codon of the AZI1). (A) Amino acid changes around AZI1 (At4g12470) locus. (B) SNPs around AZI1 locus; Synonymous amino acid: green line, non- synonymous amino acid: red line. Only genomes that were available in the SALK 1001 genomes browser (http://signal.salk.edu/atg1001/3.0/gebrowser.php) as of August 2016 were considered. (C) Representative images of contrasting PRG phenotype (day 5) of eight Arabidopsis thaliana accessions grown in +Zn or –Zn conditions. (D) Average primary root length (Day 5) of these eight accessions grown in –Zn and +Zn conditions. Experiments were independently repeated three times. Crosses show sample mean; center lines show sample medians; box limits indicate the 25th and 75th percentiles as determined by R software; whiskers extend 1.5 times the interquartile range from the 25th and 75th percentiles. Outliers are represented by dots. Shaded central region show confidence intervals of means. This graph was generated by BoxPlotR: a web-tool for generation of box plots. (E) Transcript accumulation of AZI1 in roots of these eight accessions grown for 5 days in –Zn conditions compared to +Zn conditions. Arabidopsis Ubiquitin gene was used as an internal reference. The data are given as means ± s.d. n = 10.

