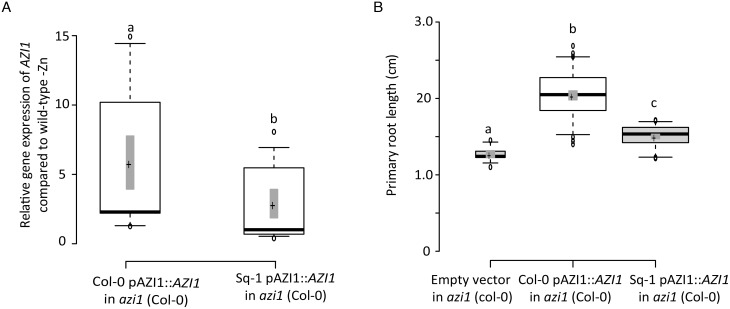
Fig 3. Natural allelic variation of the AZI1 locus underlies phenotypic variation of root length in zinc limiting conditions.
(A) Transcript level of AZI1 in azi1 lines complemented with pAZI1:AZI from either Col-0 or Sq-1 on –Zn conditions and shown as relative to +Zn condition (5 days). Five independent T3 lines were considered for this analysis. Relative expression was quantified in three biological replicates using RT-qPCR. The Ubiquitin gene was used as an internal reference. (B) Primary root length of azi1 lines complemented with pAZI1:AZI1 from either Col-0 (n = 50), Sq-1 (n = 50) or the empty vector (n = 10) on –Zn conditions (5 days). For each genotype, three repeats each containing five independent T3 lines. Box plots show analysis of the relative gene expression of AZI1 (A) and primary root length (B) in of azi1 lines complemented with pAZI1:AZI from either Col-0, Sq-1 or the empty vector on –Zn conditions. Crosses show sample mean; center lines show sample medians; box limits indicate the 25th and 75th percentiles as determined by R software; whiskers extend 1.5 times the interquartile range from the 25th and 75th percentiles. Outliers are represented by dots. Shaded central region show confidence intervals of means. This graph was generated by BoxPlotR: a web-tool for generation of box plots. Letters a, b and c indicate significantly different values at p <0.05 determined by one-way ANOVA and Tukey HSD.

