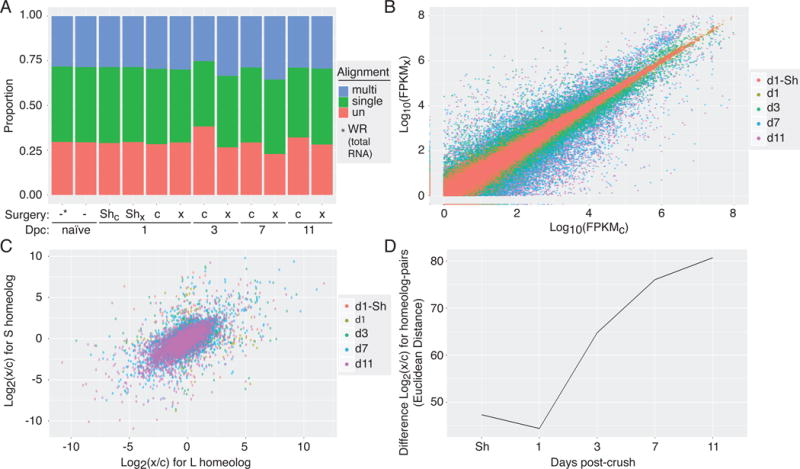
Figure 2. RNA-Seq read alignment and analysis.

(A) Proportion of RNA-Seq reads that were mapped to the Xenopus laevis 9.1 genome assembly across experimental naïve (-), contralateral control (c) and crush (x) samples demonstrates good mapping rates across the various days post-crush (Dpc). (B) Read counts, expressed as FPKM, for each gene sequenced in the crushed (FPKMC; x-axis) versus control eye (FPKMX; y-axis) showing both up- and down-regulation in the days following injury. (C) Comparison of changes in gene expression following optic nerve crush between homeolog-pairs (L x-axis, S y-axis) across the post-injury time course, shows overall correlation between pairs with clear outliers. (D) The magnitude of difference between changes in gene express among homeolog-pairs, quantified by Euclidean distance, increases over time after optic nerve injury.
