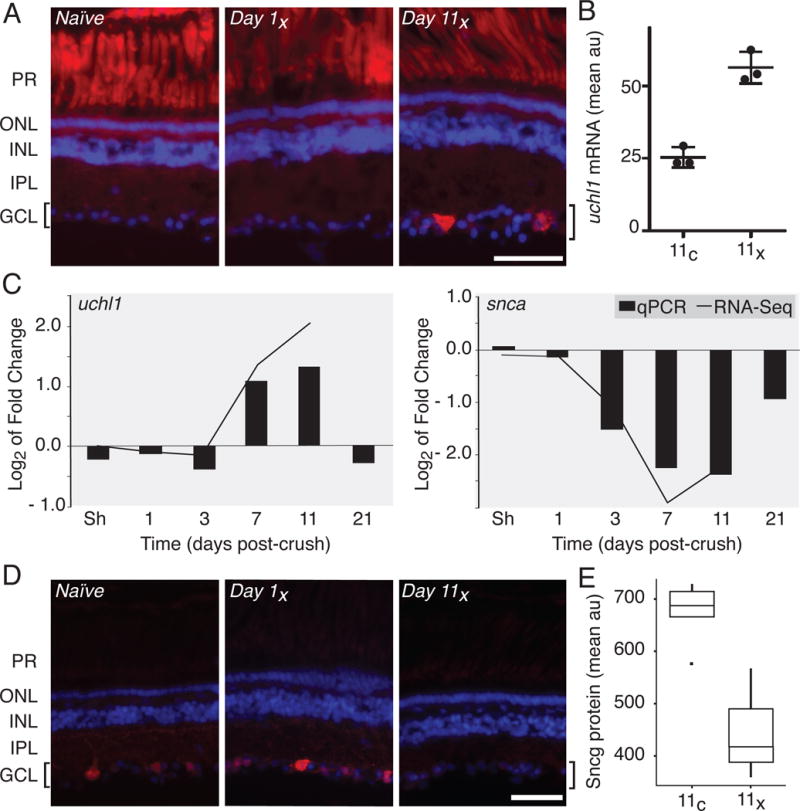
Figure 3. Independent biological validation of RNA-Seq.

The up- and down-regulation of select factors in response to optic nerve injury described in the TRAP RNA-Seq analysis was independently verified by in situ hybridization, RT-qPCR and immunofluorescence. (A) In situ hybridization demonstrates that uchl1 transcript is up-regulated unilaterally in RGCs by 11 days post-injury (Day 11x). Autofluorescence of photoreceptor cells (PR) shows no injury-dependent variability. (B) Semi-quantitative analysis of fluorescence intensity from uchl1 in situ, as shown in panel A, shows a significant up-regulation of uchl1 mRNA in the crushed eye relative to control eye in the RGC layer by day 11 (p < 0.01). Results were averaged for three retinal sections from each of three different individuals and data represent arbitrary fluorescence units (au). (C) Gene expression levels assayed using RT-qPCR for uchl1 and snca (bars) are highly correlated with changes in fold gene expression quantified by RNA-Seq (line graph). (D) As predicted by RNA-Seq, protein levels for sncg decrease over the experimental time course in injured RGCs, as seen by immunofluorescence. (E) Semi-quantitative analysis of fluorescence intensity in the RGC layer immunostained for sncg protein, as in panel D, shows strong down-regulation of sncg in crush relative to control eyes by day 11. This boxplot shows averaged results for two retinal sections from each of four different individuals and values represent arbitrary fluorescence units (au). In A and D, location of the RGCs observed in the ganglion cell layer (GCL) and highlighted by brackets, photoreceptor cell (PR) outer (ONL) and inner (INL) nuclear and inner plexiform (IPL) layers was visualized using DAPI. The scale bar is 50 μm.
