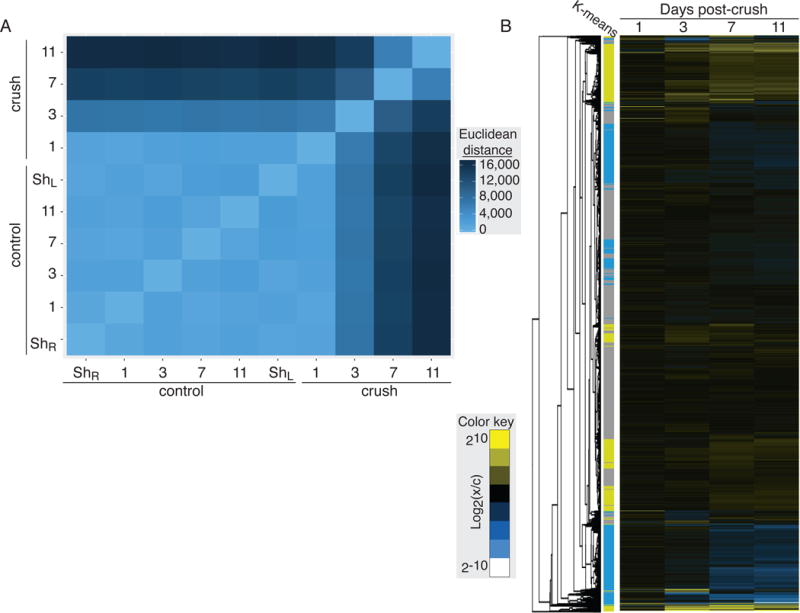
Figure 4. Global changes in RGC gene expression following optic nerve injury.

(A) The differences in transcript abundance in each sample was compared pair-wise using the Euclidean distance between FPKM values. In this heat map, the brightest blue represents the most closely related FPKM profiles. Control samples are highly similar, while samples from the optic-nerve crush show large shifts in gene expression pattern in the days following injury. (B) Hierarchical clustering of genes sequenced in RGCs across the experimental time course. Clusters of up- and down-regulated genes shows strong correspondence to groups identified by k-means clustering (groups 1 & 2 yellow, up-regulated; groups 3 & 4 blue, down-regulated; group 5 grey, unchanged).
