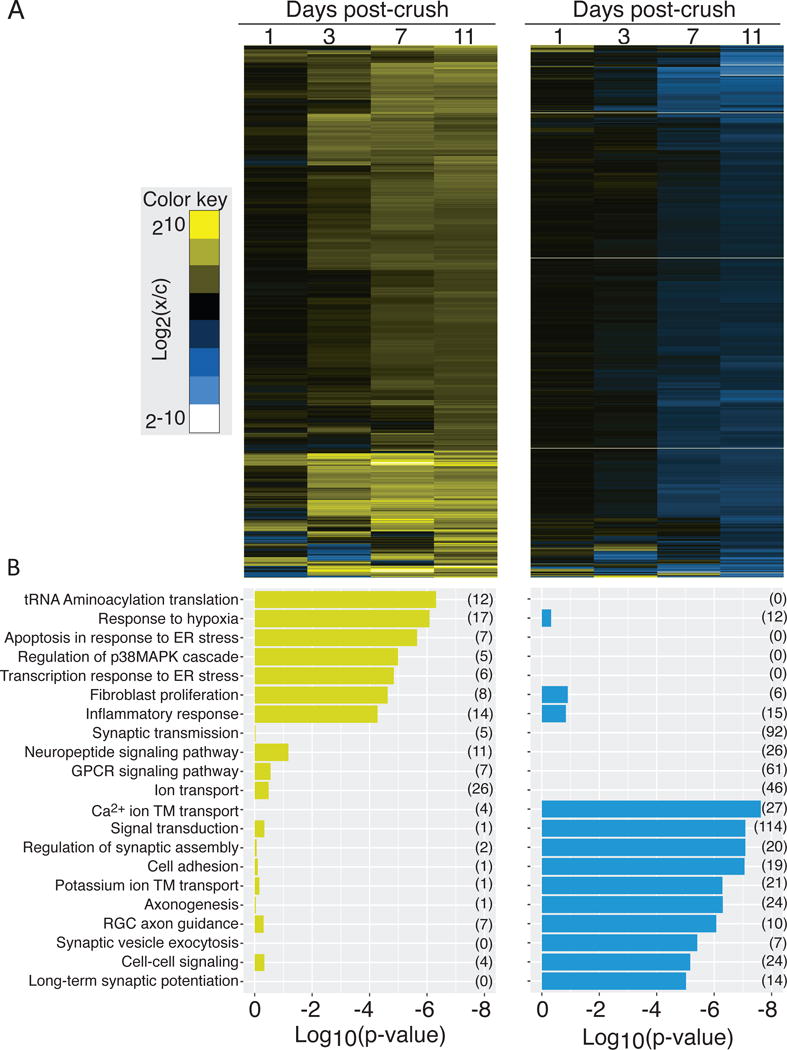
Figure 5. Functional specificity in the set of transcripts that are up- and down-regulated following retinal ganglion crush.

(A) Heat maps showing hierarchical clustering of transcripts that are up- (left) and down-regulated (right), identified by k-means clustering, following retinal ganglion crush. (B) The set of Gene Ontology biological process terms that are significantly over represented in each group of transcripts. The evidence for enrichment of each term (log10(p-value)) is plotted for the group of up- (left) and down-regulated genes (right); there is little overlap in significantly enriched terms.
