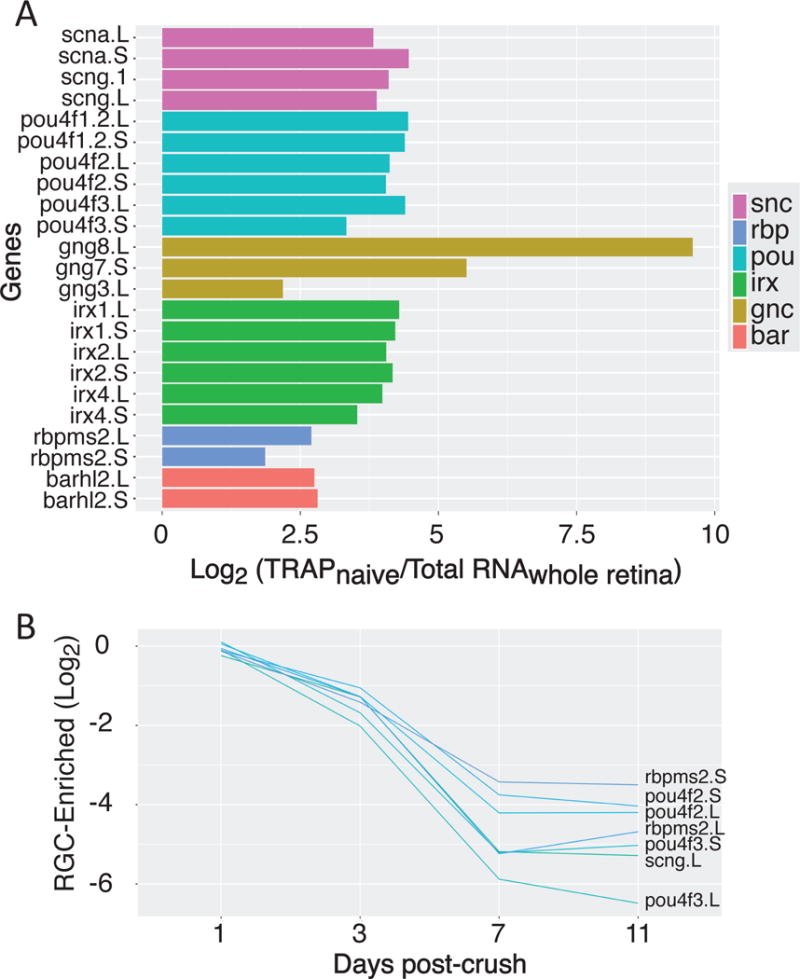
Figure 6. RGC enriched factors.

(A) Gene families that are highly enriched in naïve TRAP samples compared to total retina include key RGC-specific factors along-side novel groups. (B) When we compare gene expression in crush versus control samples, we see that optic nerve injury leads to strong down-regulation of many of these RGC-enriched genes.
