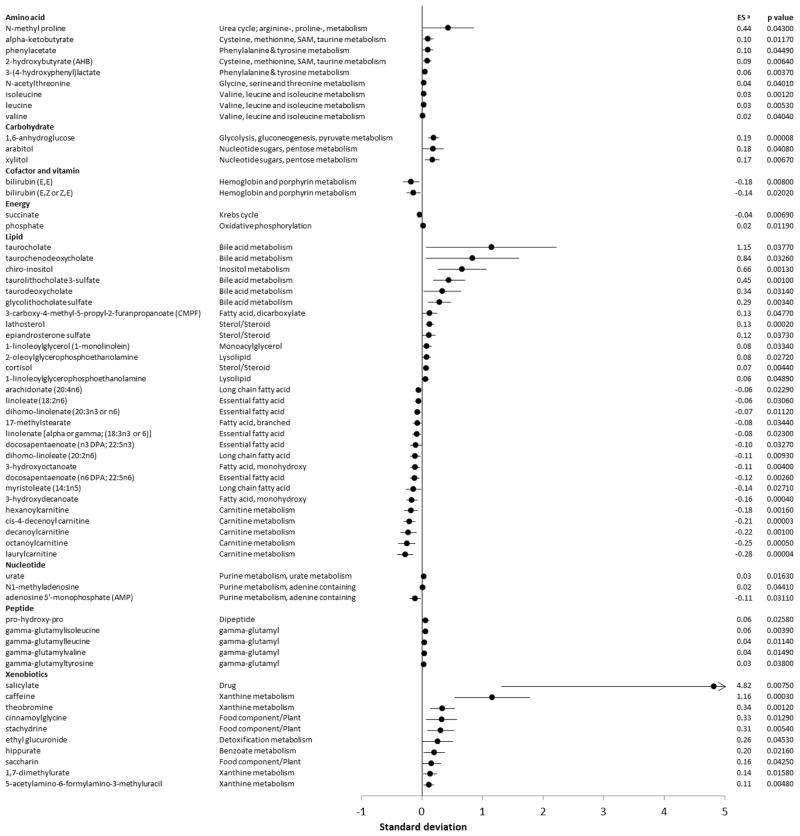
Figure 2.
Forest plot of metabolites associations with midpoint of time spent in bed. Associations shown on the plot are statistically significant, defined as false discovery rate<0.2. a Effect estimate expressed as changes in metabolite level (standard deviation, log scale) per 1 hour delay in midpoint of time. Results adjusted for age (continuous), sex (male, female), body mass index (continuous), smoking status (nonsmoker, smoker), napping (continuous), physical activity (continuous) and sampling time (continuous). Abbreviation: ES, effect size.

