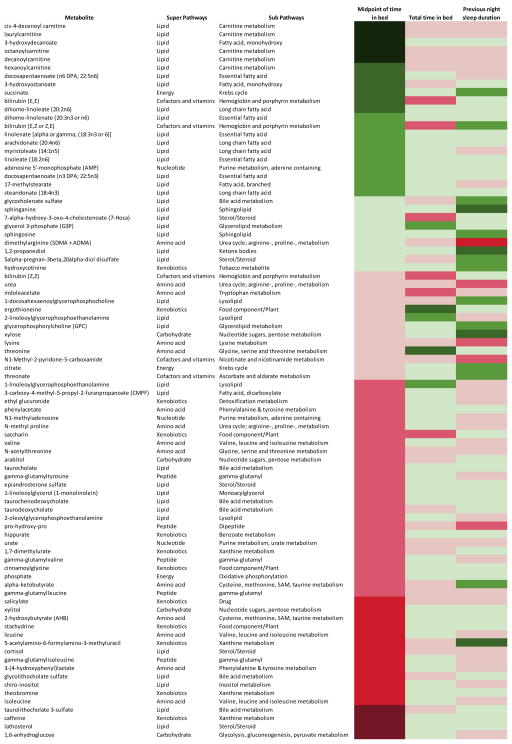
Figure 4.
This heat map shows the associations between metabolites and three sleep variables, average sleep timing, average time in bed and previous night sleep duration. Metabolites that are included in this figure have at least one association with a p-value<0.05. The 8 color codes represent different z-scores: very dark green, <−3.29 (p-value <0.001); dark green, −3.29 – <−2.58 (0.001-<0.01); medium green, −2.58 – <−1.96 (0.01-<0.05); light green, −1.96 – <0 (0.05–1); light red, >0 – 1.96 (0.05–1); medium red, >1.96 – 2.58 (0.01–<0.05); dark red, >2.58 – 3.29 (0.001–<0.01); very dark red >3.29 (<0.001). Positive z-scores suggest positive association (higher levels of metabolites with later midpoint) while negative z-scores suggest inverse association (higher levels of metabolites with earlier midpoint). All models were adjusted for age (continuous), sex (male, female), body mass index (continuous), smoking status (nonsmoker, smoker), napping (continuous), physical activity (continuous) and sampling time (continuous).

