
Fig. 5. Cortical architecture is preserved in Mbe/Mbe mutants, but acute depletion of Vps15 results in a neuronal migration defect.
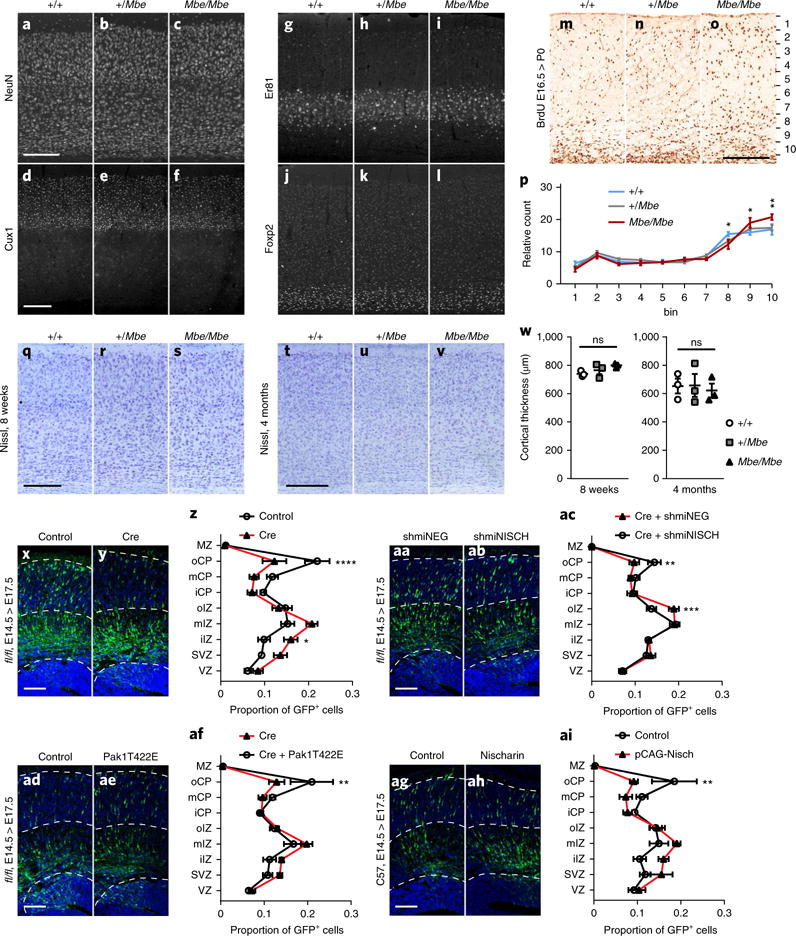
a-l, Representative immunostaining of the cortex for +/+, +/Mbe and Mbe/Mbe animals aged 8 weeks, using NeuN (a–c), Cux1, which labels layers II-IV (d–f), Er81, which labels layer V (g–i), and Foxp2, which labels layer VI (j–l; n = 3 animals per genotype). Cortical lamination is preserved in Mbe/Mbe mutants. These experiments were performed twice with similar results. m–p, Birthdate labeling results, showing representative coronal sections stained with sera against BrdU. BrdU was delivered to pregnant dams at E16.5, followed by analysis of brains at P0. The cortex was divided into ten equal bins and the distribution of BrdU+ cells mapped for +/+, +/Mbe and Mbe/Mbe animals (n = 3 animals per genotype). There was a significant interaction effect between genotype and distribution of cells across all bins (n = 3 animals per genotype; two-way repeated-measures ANOVA with Tukey’s multiple-correction test; F18,54 = 2.081, P = 0.02). In addition, there was a significant accumulation of BrdU+ neurons in bins 9 (+/+ vs. Mbe/Mbe, P = 0.018) and 10 (+/+ vs. Mbe/Mbe, P = 0.002; +/Mbe vs. Mbe/Mbe, P= 0.008), with a concomitant reduction of BrdU+ neurons in bin 8 (+/+ vs. Mbe/Mbe, P= 0.01). q–v, Representative Nissl staining of the somatosensory cortex of +/+, +/Mbe and Mbe/Mbe animals aged 8 weeks (q–s) and 4 months (t–v). w, Quantification of cortical thickness reveals no significant difference between genotypes (n = 3 animals per genotype; one-way ANOVA with Tukey’s multiple comparison; 8 weeks: +/+ vs. Mbe/Mbe, P= 0.13; +/Mbe vs. Mbe/Mbe, P = 0.44; 4 months: +/+ vs. Mbe/Mbe, P = 0.93; +/Mbe vs. Mbe/Mbe, P = 0.91). x–ai, Representative images for in utero electroporation experiments. Constructs were electroporated at E14.5 before analysis at E17.5. (x–z) Electroporation with a control vector or pCAG-Cre in Vps15 fl/fl animals revealed an accumulation of cells in the intermediate zone with a concomitant reduction in the cortical plate (n = 6 animals per condition; interaction P < 0.0001). (aa–ac) Expression of a shmiRNA targeting Nischarin (shmiNISH) partially rescues the phenotype caused by Cre mediated Vps15 depletion (shmiNEG, negative control shmiRNA; n = 4 animals per condition; interaction P = 0.002). (ad–af) Overexpression of a phosphomimetic mutant of Pak1 (T422E) partially rescues the phenotype caused by Cre mediated Vps15 depletion (n = 6 animals per condition; interaction P = 0.03). (ag–ai) Overexpression of Nischarin (pCAG-Nisch) in wild-type mice results in a defect in neuronal migration with a notable reduction in the number of GFP+ cells in the cortical plate (n = 4 animals per condition; interaction P = 0.01). VZ, ventricular zone; SVZ, subventricular zone; IZ, intermediate zone; CP, cortical plate; MZ, marginal zone; oCP, mCP, iCP, oIZ, mIZ and iIZ, outer, inner and medial CP and IZ, respectively. For x–ai we used two-way repeated-measures ANOVA with Bonferroni multiple-comparison tests; see Supplementary Table 1. **P< < 0.01; ***P< 0.001; ****P< 0.0001. Scale bars in a, d, o, q and t: 200μm; in x, aa, ad and ag: 100μm. Error bars show mean ± s.e.m.