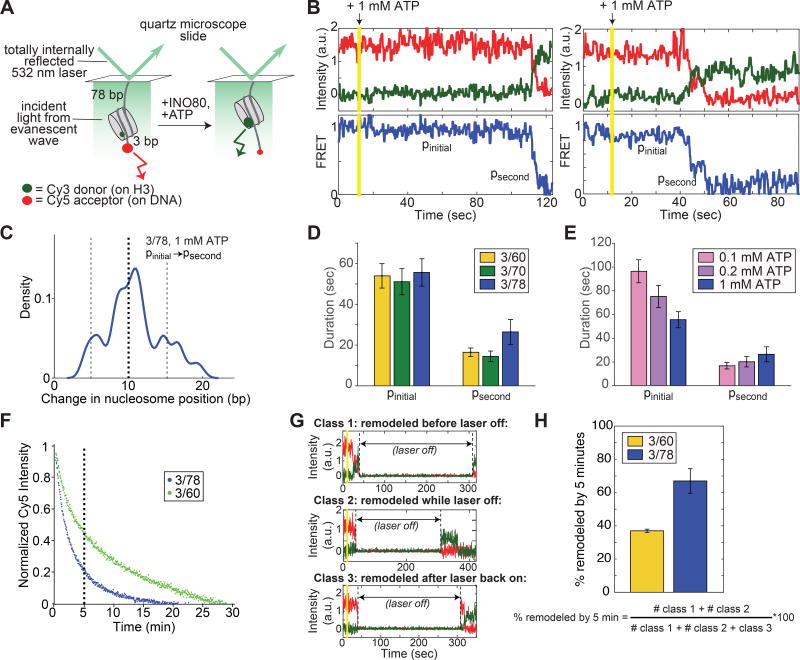
Figure 2. Remodeling by INO80 at the single nucleosome level is preceded by a long pause, followed by rapid nucleosome translocation.
(A) Schematic of the smFRET assay. Nucleosomes are immobilized on the surface of microscope slides and imaged with a prism-based TIRF microscope (see Methods). For the 3/78 nucleosome shown here, the nucleosome starts 3 bp from the Cy5-labeled DNA end, with a 78 bp linker attaching the nucleosome to the surface, resulting in an initial high FRET efficiency (Figure S3A). As remodeling proceeds, the nucleosome is moved towards the 78 bp flanking DNA and the FRET efficiency is reduced.
(B) Example timecourses of remodeling from individual, surface-attached, 3/78 nucleosomes in the presence of saturating INO80 and ATP (15 nM and 1 mM respectively), imaged at 7.4 Hz and smoothed (for visualization only) with a median filter with a 1-second window. Vertical yellow line indicates the time at which ATP is introduced into the sample chamber to start the remodeling reaction. We refer to the long initial pause exhibited by all trajectories as pinitial, and to a secondary pause, exhibited in about three quarters of remodeling events (Figure S3B,C), as psecond. Additional example timecourses are shown in Figure S4.
(C) Kernel density estimation (KDE) plot of the change in nucleosome position between pinitial and psecond for the 78 3/78 nucleosomes (out of 100 3/78 nucleosomes total with 1 mM ATP) that exhibit a secondary pause. KDEs are conceptually similar to histograms, but have a smoothing parameter rather than a bin size (see also Figure S3). The peak in the density around 10 bp indicates that the majority of the trajectories that show secondary pauses on 3/78 nucleosomes have translocated the nucleosome about 8–12 bp before the secondary pause is encountered. KDE has a Gaussian kernel with bandwidth 0.025.
(D) Quantification of the average durations of the initial and secondary pauses as a function of entry DNA length, for 3/60, 3/70, and 3/78 nucleosomes. Some traces exhibit more than one secondary pause; however these traces are too few to gain accurate statistics beyond the psecond pause.
(E) Quantification of the average durations of the initial and secondary pauses as a function of ATP concentration, for 3/78 nucleosomes. 1 mM ATP is saturating, while 0.1 mM and 0.2 mM are both sub-saturating, though still well above the Km (Figure S3D,E; (Udugama et al., 2011)). Dark blue data are the same as in C. The increase in pinitial duration with decreasing ATP concentration is greater than the error on the measurements; the slight decrease in psecond, however, is not. Data in (D) and (E) represent means±S.E.M. obtained via a bootstrapping approach (see Methods).
(F) Overall remodeling rates for 3/60 and 3/78 nucleosomes, as measured by ensemble FRET, at 20°C in imaging buffer (see Methods), under single turnover conditions and with saturating enzyme and ATP. Each curve is the average of two independent replicates as described in the Methods. After 5 minutes (vertical dashed line), the ensemble remodeling reaction on 3/78 nucleosomes is nearly 80% complete, while the reaction on 3/60 nucleosomes is only about 50% complete.
(G) Example timecourses of remodeling of 3/60 nucleosomes in the presence of 1 mM ATP, with the laser that excites the Cy3 dye turned off for 5 minutes as indicated. While the laser is off, all dye intensities go to zero. Three kinds of behavior are observed: some nucleosomes are remodeled before the laser is turned off (Class 1, top); some nucleosomes are remodeled after the laser is back on (Class 3, bottom); and some nucleosomes have high Cy5 intensity before the laser is turned off, but high Cy3 intensity when the laser is turned back on (Class 2, middle). These Class 2 nucleosomes must have remodeled during the 5 minutes that the laser was off, because no change in Cy5 signal is observed with the laser off in the absence of ATP.
(H) Quantification of how many nucleosomes are remodeled in the first 5 minutes of the smFRET reaction when the laser is turned off as in the examples in G. Data represent means±S.E.M. for three replicates, where the fraction remodeled was calculated for each replicate according to the expression below the bar graph.

