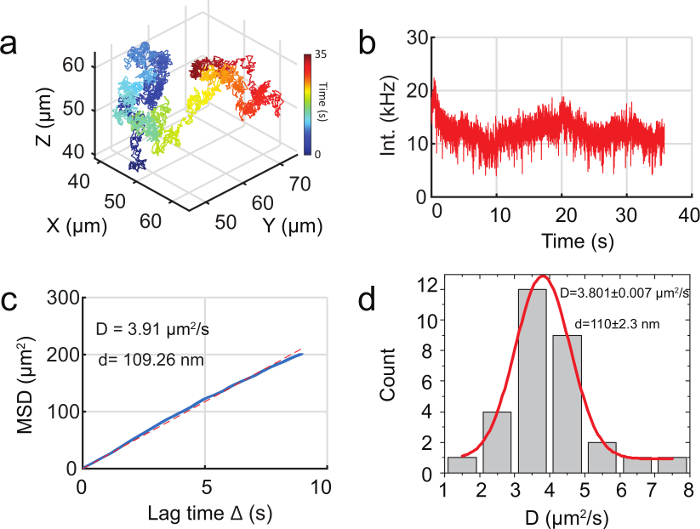
Figure 5. Tracking 110 nm fluorescent particles in water with 3D-DyPLOT. ( a ) 3D trajectory of a freely diffusing 110 nm fluorescent nanoparticle in water. ( b ) Fluorescent intensity as a function of time for the trajectory in ( a ). ( c ) MSD of the trajectory in ( a ). The blue line is the measured MSD while the dotted red line is best fit line from linear regression. ( d ) MSD analysis of 30 trajectories, showing a mean hydrodynamic diameter of 110 nm, in good agreement with the size of the fluorescent nanoparticles being tracked. The diameter of the particles was calculated using the Stokes-Einstein relation. Please click here to view a larger version of this figure.
